Summer break is ending, and back to school is just around the corner. For those with kids heading back to the classroom, it’s time to get in the last-minute doctor’s appointments and pick up school supplies. For the fresh produce industry, it’s time for cafeteria and lunchbox staples, such as snack-pack carrots and apples, to see an uptick in prices as increasing demand adds pressure to supply.
Despite back-to-school demand, overall produce prices are on the decline. As a result, the ProduceIQ index is continuing its downward trend for the third week. We anticipate this soft-declining trend to continue despite extreme heat that is challenging supply.
ProduceIQ Index: $1.39 /pound, -2.1 percent over the prior week
Week #30, ending July 29th
Blue Book has teamed with ProduceIQ BB #:368175 to bring the ProduceIQ Index to its readers. The index provides a produce industry price benchmark using 40 top commodities to provide data for decision making.
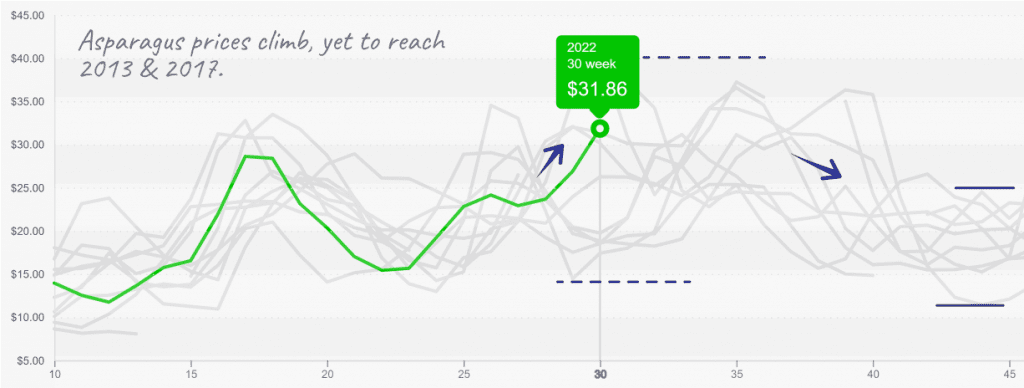
Asparagus prices are leaping over hurdles such as poor growing conditions and shipping delays to reach U.S. consumers. Average FOB prices are +20 percent over the previous week. At over $31, asparagus prices are closing in on the extreme prices of 2013 and 2017.
Port delays in Peru and colder temperatures are affecting Peruvian supply, while in Mexico, too little rain and heat are firing up asparagus prices. In addition, Central Mexico’s growing season is winding down, and crop production is transitioning to the Northern Baja Region.
This time of year, Mexico’s Asparagus production is considerably lower; however, it still accounts for approximately 50 percent of all available product in the U.S. Therefore, expect prices to escalate through early August as supply fluctuates.
Asparagus, 11lb Large/XL/Jumbo, surpasses $31 after 8-week climb.

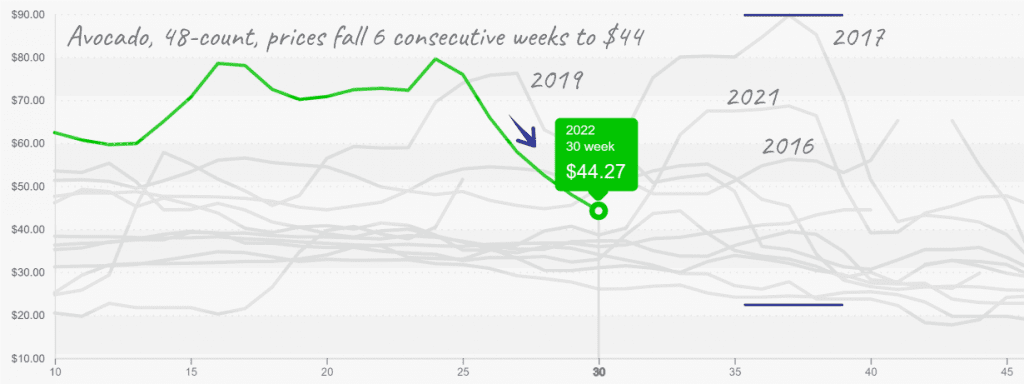
Avocados are at their lowest prices since December 2021. Supply in the U.S. is solid now, thanks to the steady product from Mexico and Peru. Columbia and California are on the decline but are still contributing to available supply in a small way.
Because the Mexican avocado output is higher now, the discount that buyers usually get when purchasing Peruvian avocados is less noticeable. As a result, buyers tend to restart with Mexican avocados this time of year.
Supplies should stay steady but may decline when Peru wraps up its export season towards the end of August. So, feel free to commence with all the guacamole making you’ve been missing for the last seven months.
Avocado prices are getting reasonable, though history shows supply constraints are not predictable.


It’s time to say goodbye to strawberries from Salinas/Watsonville, and we are berry sad. Due to California grower’s declining output, average FOB prices are up +27 percent over the previous week. At $12.60, it’s hard to imagine that prices were nearing a ten-year low just a few weeks ago.
Strawberry prices typically escalate in the late summer and continue through the end of the year. However, this year, the strawberry market’s characteristic price increase may begin earlier and intensify due to poor growing conditions and rising inflation costs.
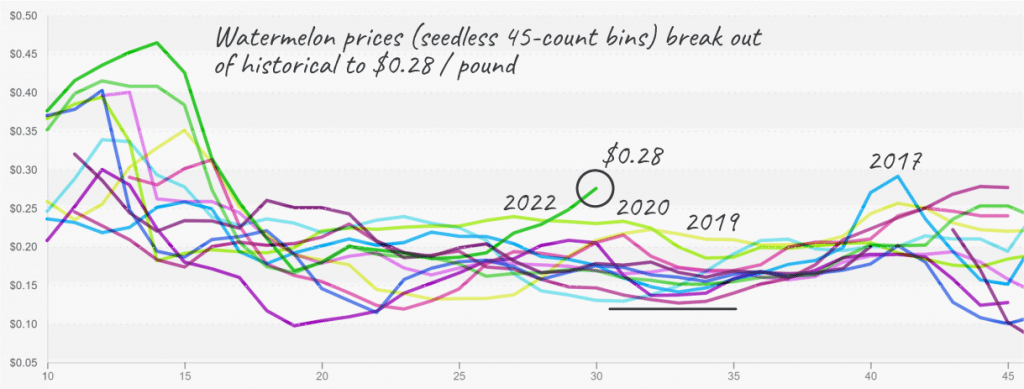
Speaking of poor growing conditions, challenging weather is causing watermelon prices to soar. In the summer, domestic watermelon markets fragment across multiple states. And as a result, prices typically stay steady. But this year, poor growing conditions in most places (except surprisingly California) are thwarting our plans to subsist entirely on the delectably refreshing fruit until fall gives us a needed respite from the summer heat.
Demand will most likely stay high until fall brings cooler weather, but fortunately, supplies are expected to improve over the next few weeks slowly. That should make our favorite summer fruit a bit more affordable.
Watermelon prices break records for this time of year.


Please visit Stores to learn more about our qualified group of suppliers, or our online marketplace, here and enjoy free access to our market tools which created the graphs above.
ProduceIQ Index
The ProduceIQ Index is the fresh produce industry’s only shipping point price index. It represents the industry-wide price per pound at the location of packing for domestic produce, and at the port of U.S. entry for imported produce.
ProduceIQ uses 40 top commodities to represent the industry. The Index weights each commodity dynamically, by season, as a function of the weekly 5-year rolling average Sales. Sales are calculated using the USDA’s Agricultural Marketing Service for movement and price data. The Index serves as a fair benchmark for industry price performance.


