And you thought your teenager was a bad procrastinator. Over the weekend, Congress passed a bill to extend government spending with mere hours to spare.
The bill will allow the government to operate for 45 more days. Just long enough for members of Congress to take Brene Brown’s newest Masterclass on the human emotions of courage and empathy.
Residents in the tri-state area are still wringing out their fall coats after a very wet weekend, as 2-8 inches of rain fell in Connecticut, New York, and New Jersey. Fortunately for already elevated fresh produce prices, there aren’t many crops in the affected area. Although, the abnormally wet weather may have caused some minor logistics delays.
Blueberries are El Nino’s most haunting victim yet. A relatively new commodity for Peruvian growers that some believed was too big of a risk to try in the first place. However, in a short time, Peruvian growers have proven that they can be a leader in the world market. But this fall, those fears of too few cold hours are returning to plague growers.
Prices are up another +26 percent over the previous week and are forecasted to climb even higher. Import volumes are about half of last year’s in week #39. Supply is forecasted to improve in late October/November.
Blue Book has teamed with ProduceIQ BB #:368175 to bring the ProduceIQ Index to its readers. The index provides a produce industry price benchmark using 40 top commodities to provide data for decision making.
ProduceIQ Index: $1.24/pound, up +3.3 percent over prior week
Week #39, ending September 29th
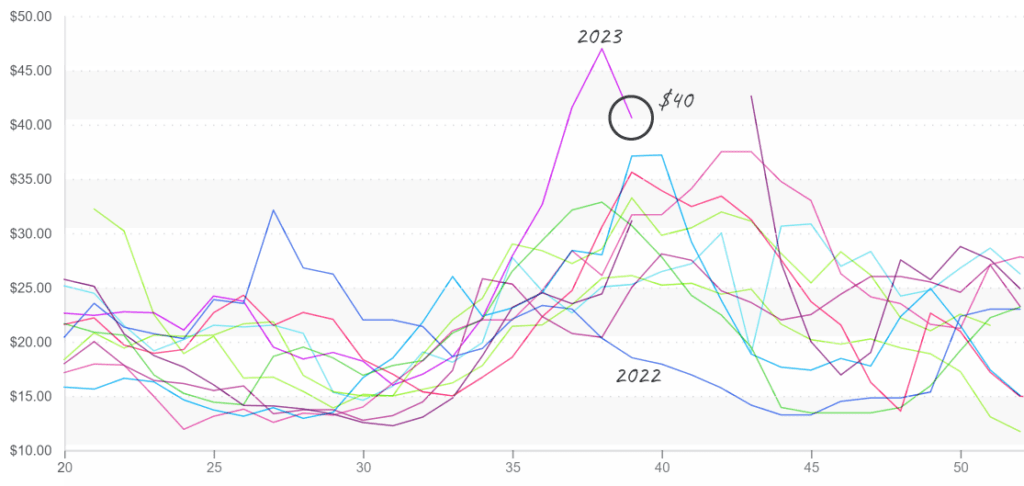
At over $40, Eastern blueberry prices are significantly higher than last year; 2022 was below $20 for this week #39

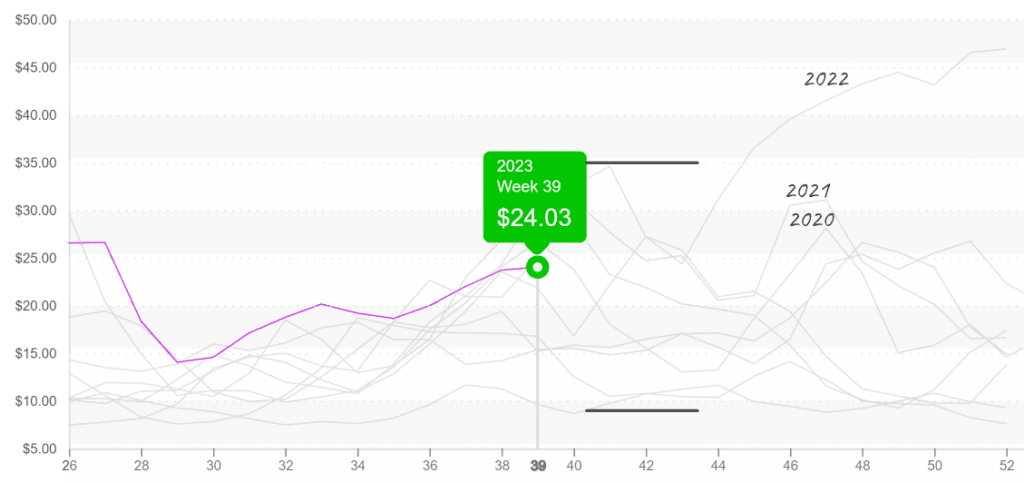
Broccoli prices stall for the second week. Although broccoli prices typically increase this time of year because of declining domestic availability, this week’s prices are above average for week #39. Supply from Salinas, CA, is low because of quality issues, Mexican growers are still ramping up production, and back-to-school demand is very strong.
As broccoli volume from Mexico increases over the next few weeks, prices may return to normal.
Broccoli prices enter a volatile period when prices have reached new highs in each of the past three years.


6,000 cases of cantaloupes were voluntarily recalled over the weekend due to possible Salmonella contamination. Cantaloupe recalled in 19 states, Washington D.C., due to possible Salmonella contamination – Produce Blue Book
Tough news for melon markets. Already up +7 percent over the previous week due to tightening supply. Volume out of the San Joaquin Valley is short, but nothing unheard of for week #39. Like many commodities, pricing is above average and may increase more as growers transition out of California and into Arizona.
Lime markets aren’t backing down. Prices rose another +3 percent this week to $43. Too much rain in the old crop’s growing regions and too little rain in the new is tightening supply, especially on larger fruit. Expect prices to remain elevated for the immediate future.
Replacing your limes with lemons won’t do much to abate costs. At $33, lemons are also well above average for week #39. Volume should improve slowly throughout October as supply from the new crop increases.
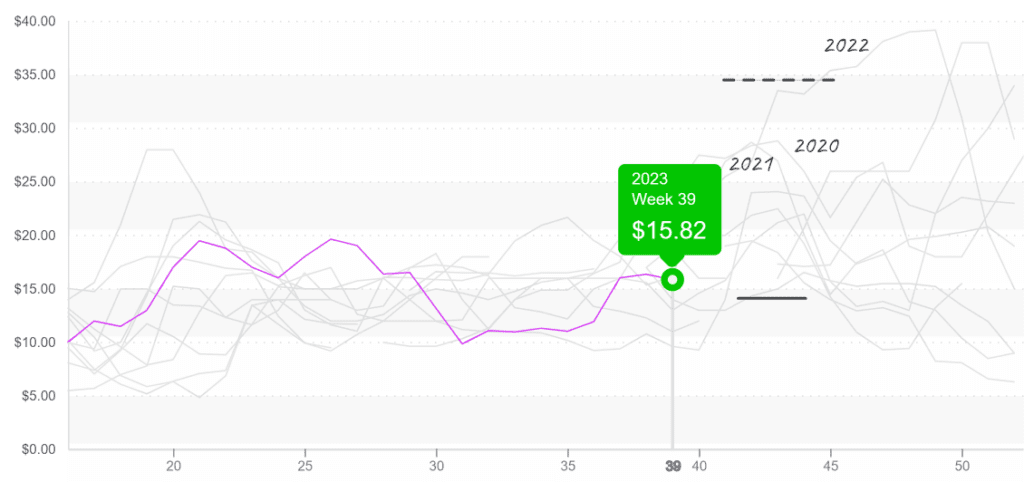
While many of the commodities in the ProduceIQ index are enduring higher-than-average prices, most tomato varieties are surprising us as outliers. Round, grape-type, and roma tomatoes are all experiencing below or near-average prices for week #39. Prices are forecasted to descend further before leveling out as cooler fall weather closes out domestic growing regions.
Round Tomato (25lb, 5×6, Eastern) prices are $16 and are entering a period of increasing prices.


ProduceIQ Index
The ProduceIQ Index is the fresh produce industry’s only shipping point price index. It represents the industry-wide price per pound at the location of packing for domestic produce, and at the port of U.S. entry for imported produce.
ProduceIQ uses 40 top commodities to represent the industry. The Index weights each commodity dynamically, by season, as a function of the weekly 5-year rolling average Sales. Sales are calculated using the USDA’s Agricultural Marketing Service for movement and price data. The Index serves as a fair benchmark for industry price performance.


