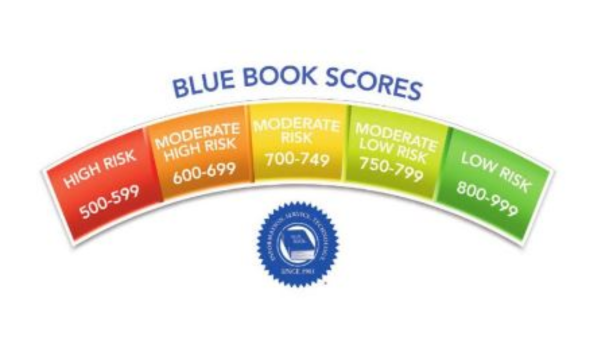
So how are Blue Book scores derived? In one word—data.
Data drives nearly all decisions made today. In the case of scoring, data is pay information shared by industry sellers, and comes in the form of survey responses and accounts receivable (A/R) aging data.
Survey data has been, and continues to be, the predominate data point, while A/R has grown exponentially over the last several years and is expected to surpass survey data in the near future.
Blue Book receives tens of thousands of survey responses annually, which not only support the tried-and-true rating system, but also allow company analysts to better predict future events through scores.
Monthly A/R contributors confidentially share data to the tune of nearly $2 billion dollars of receivables each month—an incredible amount of real-time pay data.
In return for sharing their A/R data, companies receive complimentary risk management tools that offer greater insight into emerging customer trends.
Whether from surveys or A/R aging files, pay data that reflects an average beyond 30 days (with built-in grace periods) is most detrimental to a score. Data reflecting payments handled or aging within 30 days is most desired for a satisfactory score.
Survey data measures how obligations are paid, on average, while A/R aging is a snapshot of open customer invoices and a measurement of how a buyer is ‘aging’ with its vendor.
The Calculus of Pay Experiences
It’s understood that pay data is more a reflection of a vendor’s experience with a customer than how a buyer actually pays its obligations. At least in specificity of days.
Buyers do have control over how quickly they pay invoices, but if checks are still going out in the mail or sellers are slow to invoice, some of these obstacles can have an impact on scores and pay ratings.
Remember, a pay rating, the primary scoring attribute, is shared based on date of invoice or receipt of payment.
Also, a seller may recognize a receivable before a buyer recognizes a payable. If a company pays at 30 days from receipt of invoice, it’s highly likely the vendor will experience a payment sometime thereafter.
At the end of the day, a buyer wants to be sure the seller receives payment within 30 days to be assured of a satisfactory rating and score. This may mean paying 5 to 7 days sooner, or more, to account for obstacles that may be out of a buyer’s control.
As mentioned, scores are data driven, but much more goes into the output.
Users tend to focus on current performance: “We pay in 21 days!” is something we often hear. And while this is great, especially if a company is trying to improve its score, pay history plays a significant role.
For example, a company that pays consistently at 30 days and has been doing so for several years could indeed have a better score than a company that has been paying at 10 days for the last several months but shows historical inconsistencies.
Pay performance consistency with vendors, whether at 10 or 30 days, is important. It’s best to pay consistently, even if it might be a bit slower than others who might be paying some in 10, a few at 21, and another handful in 30 days.
Why? Because scoring models identify payment tendencies, and if, for instance, payment tendency had been recognized as 10 days but shifts from 10 to 21—either because of choice, mail, vendor invoicing, or another factor—a score can be adversely affected.
However, such a shift will not alter risk perception, as risk would remain low since pay responses within that time period are considered satisfactory.
Table 2 is a simple hypothetical example of how a score change would work from one month to the next if data reflected a shift in overall performance.


The score declined from January to February because the scoring model sees that pay performance, though still very good, is now “slower.”
But, even though the score has declined, it continues to be regarded as low risk.
This an excerpt from the Credit and Finance department in the May/June 2022 issue of Produce Blueprints Magazine. Click here to read the whole issue.


