The U.S. consumer price index increased +7.9% for the 12 months ending February 2022. This was the largest 12-month increase since July 1981, according to the Bureau of Labor Statistics.
IRI-measured multi-outlet stores in the U.S., including supermarkets, club, mass, supercenter, drug, military, and other retail food stores, also showed continued grocery price inflation over and above the elevated 2020 and 2021 levels.
In February 2022, the average price per unit across all foods and beverages was up +10.3% versus the same weeks in 2021 and +16.8% versus February 2020. This means continued acceleration in the rate of inflation since the fall of 2021. For the latest 52 weeks ending February 27, 2022, prices increased +6.0% — the annualized number pulled down by much milder inflation in the second quarter of 2021.
“In our February IRI shopper survey, we found that 90% of shoppers have noticed the price increases across the various grocery departments and a whopping 96% of those consumers are concerned about it,” said Jonna Parker, Team Lead for IRI.
“In response, 75% of consumers have already made one or more changes to their grocery shopping, up considerably from 64% in January 2022. Additionally, consumers are pulling back on restaurant visits. This is not so much because of COVID-19, but as a means to save. Consumers are estimating that 82% of their meals in a typical week are prepared at home as of February 2022.”

Fresh produce prices are also up from last year at a slightly higher rate than total food and beverages. In February 2022, the price per pound for total fresh produce increased by +10.9% over February 2021. The latest 52-week look was lower, at +7.6%, given the much milder inflation in the second quarter of 2021. Fresh vegetable inflation was far below average, at +6.2 in February, contrary to fruit that reached its highest levels seen yet, at +16.1%.
“Fresh produce inflation reached double digits and consumers’ concern over these kinds of price increases is shared by the industry,” said Joe Watson, VP, Retail, Foodservice & Wholesale for IFPA. “Consumers are focused on finding good prices and promotions and minimizing waste at home, which puts great emphasis on freshness and shelf life in the store. At the same time, consumers balance their spending across canned, frozen and fresh purchases and many simply buy less to stick to their budgets. Many of the measures pressure volume sales.”


February 2022 Sales
January 2022 brought $67 billion in food and beverage sales — up +5.8% over 2021 and +18.6% over 2020. However, inflation played a significant role with year-on-year unit sales down -3.0%. Perishables, including produce, seafood, meat, bakery and deli, had the highest year-over-year sales growth in 2021, at +6.2%. However, fresh produce sales gains were below average in both dollars and units.


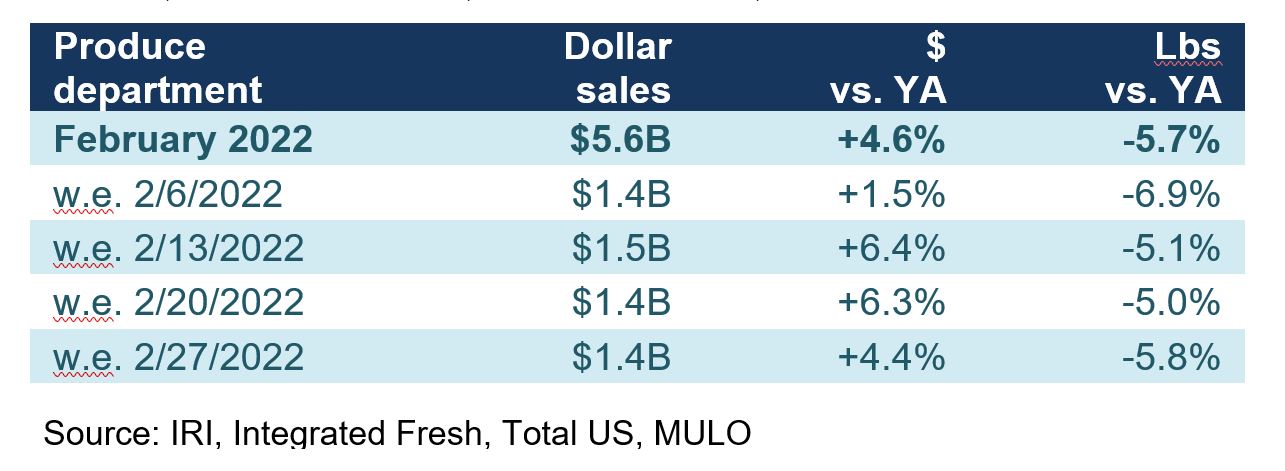
From a dollar sales perspective, February 2022 reached sales of $5.6 billion, surpassing the record set in 2021. However, dollar gains were inflation-boosted and units and volume sales declined year-on-year.
“We certainly have to acknowledge that big price increases tend to pressure volume sales,” said Watson. “But it is also important to note that it is hard to measure the effect of supply chain disruption: we cannot sell what we do not have. Out-of-stocks have been a severe problem for departments across the store since the start of the pandemic and fresh produce has also been affected by the labor, transportation and other supply chain issues. Actively communicating and providing recommendations for alternatives are important best practices in case of out-of-stocks.”


Valentine’s Day week was the biggest, with sales reaching nearly $1.5 billion. While dollars gained versus year ago for each of the weeks, volume was down between 5.0% and 6.9% when compared to the same four February weeks in 2021.
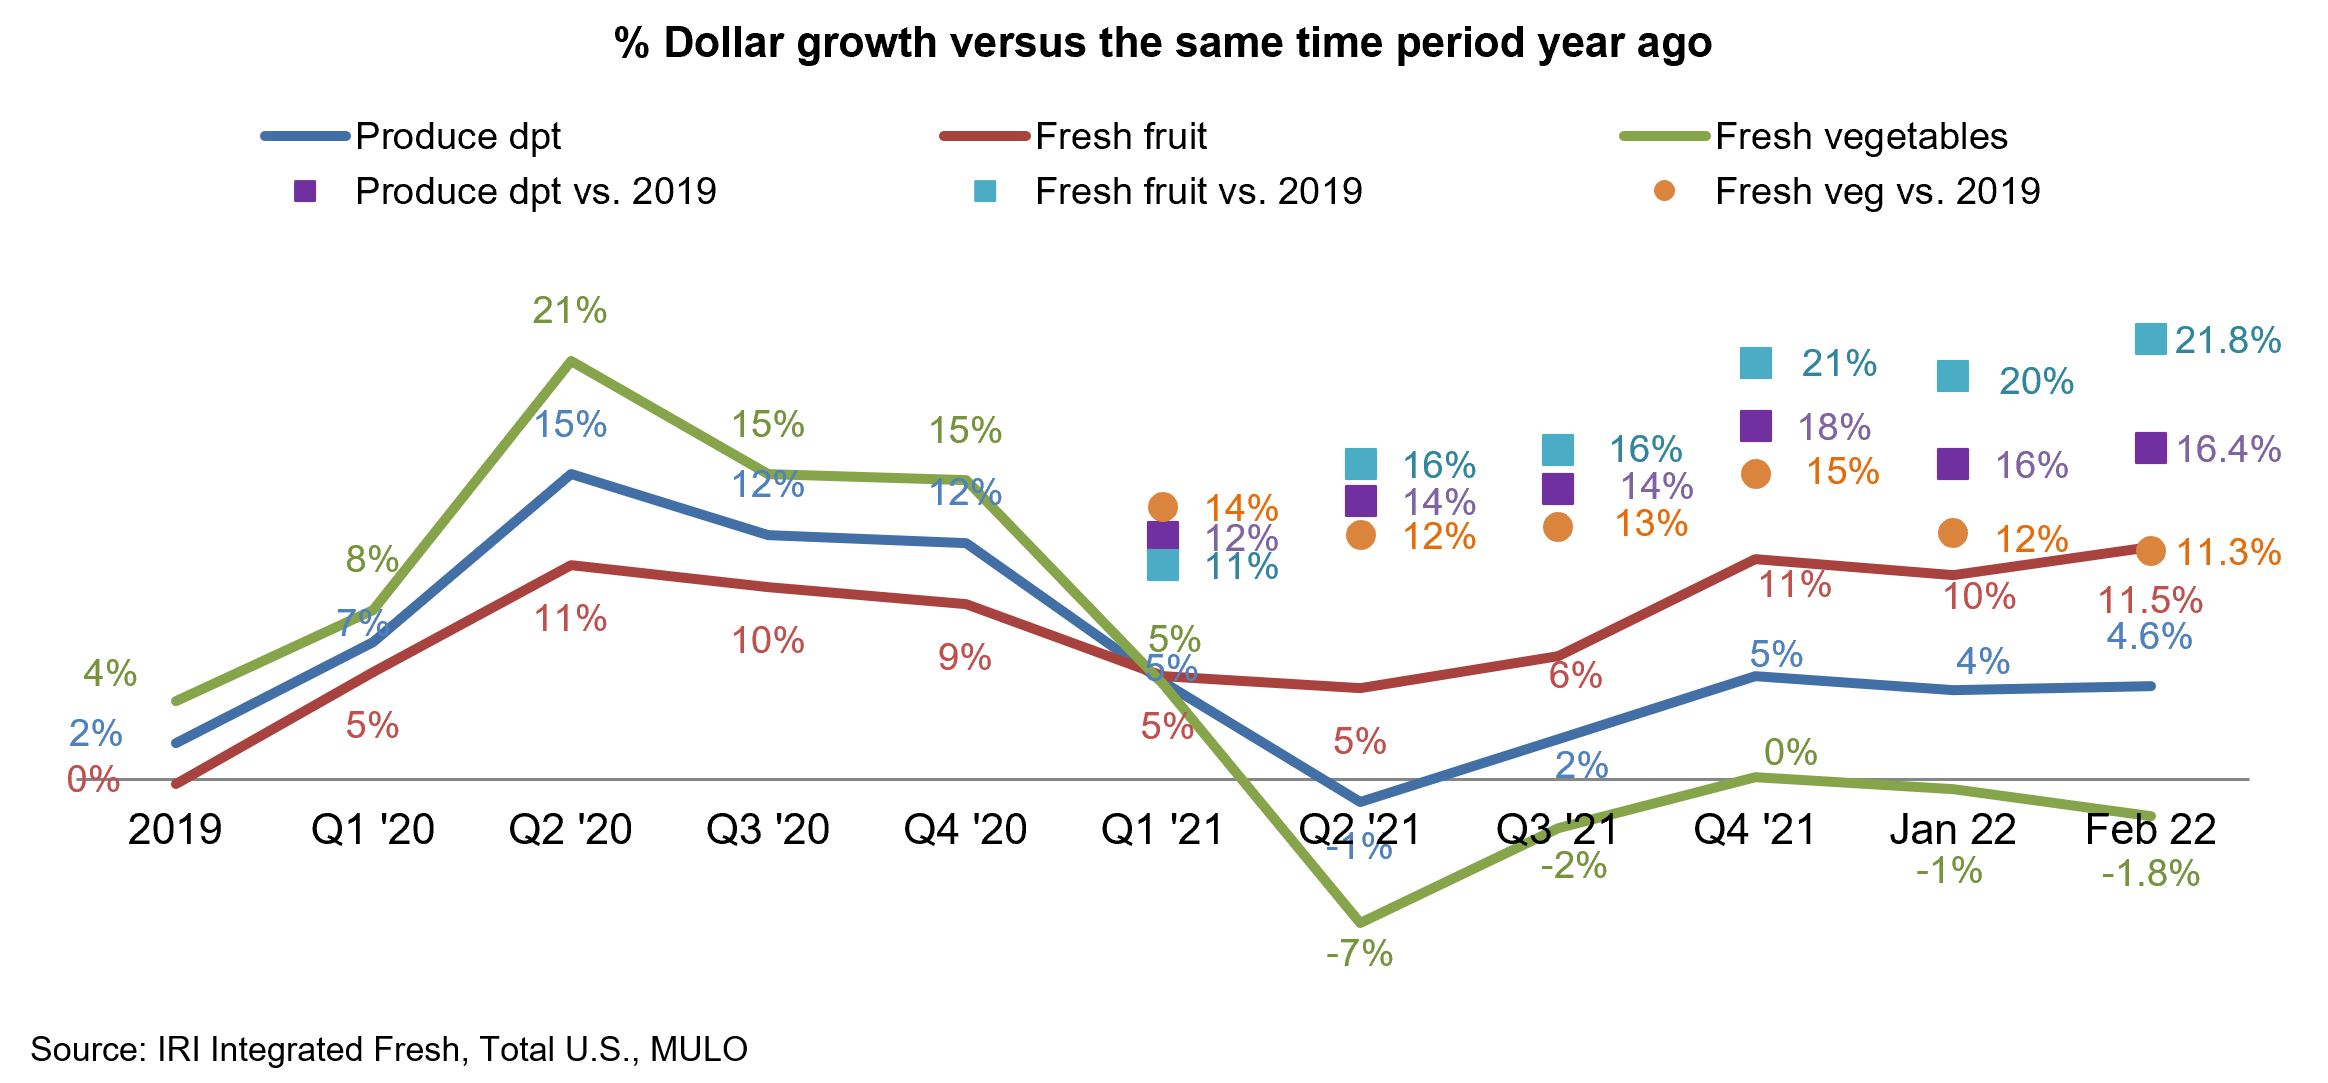
While fruit sales growth never dipped below year-ago levels, vegetable sales growth has been mostly trending in the negative since lapping March 2020. Despite a lower-than-average price increase, only very briefly did vegetable sales exceed year-ago levels in the fourth quarter of 2021.


Fresh Produce Share of Total Fruits and Vegetables
Shelf-stable fruits had a strong, though inflation-boosted February with sales gains of 10.3% year-on-year. Both frozen and shelf-stable are heavily impacted by supply chain disruptions and assortment as well as inventory levels have been down significantly over recent months.


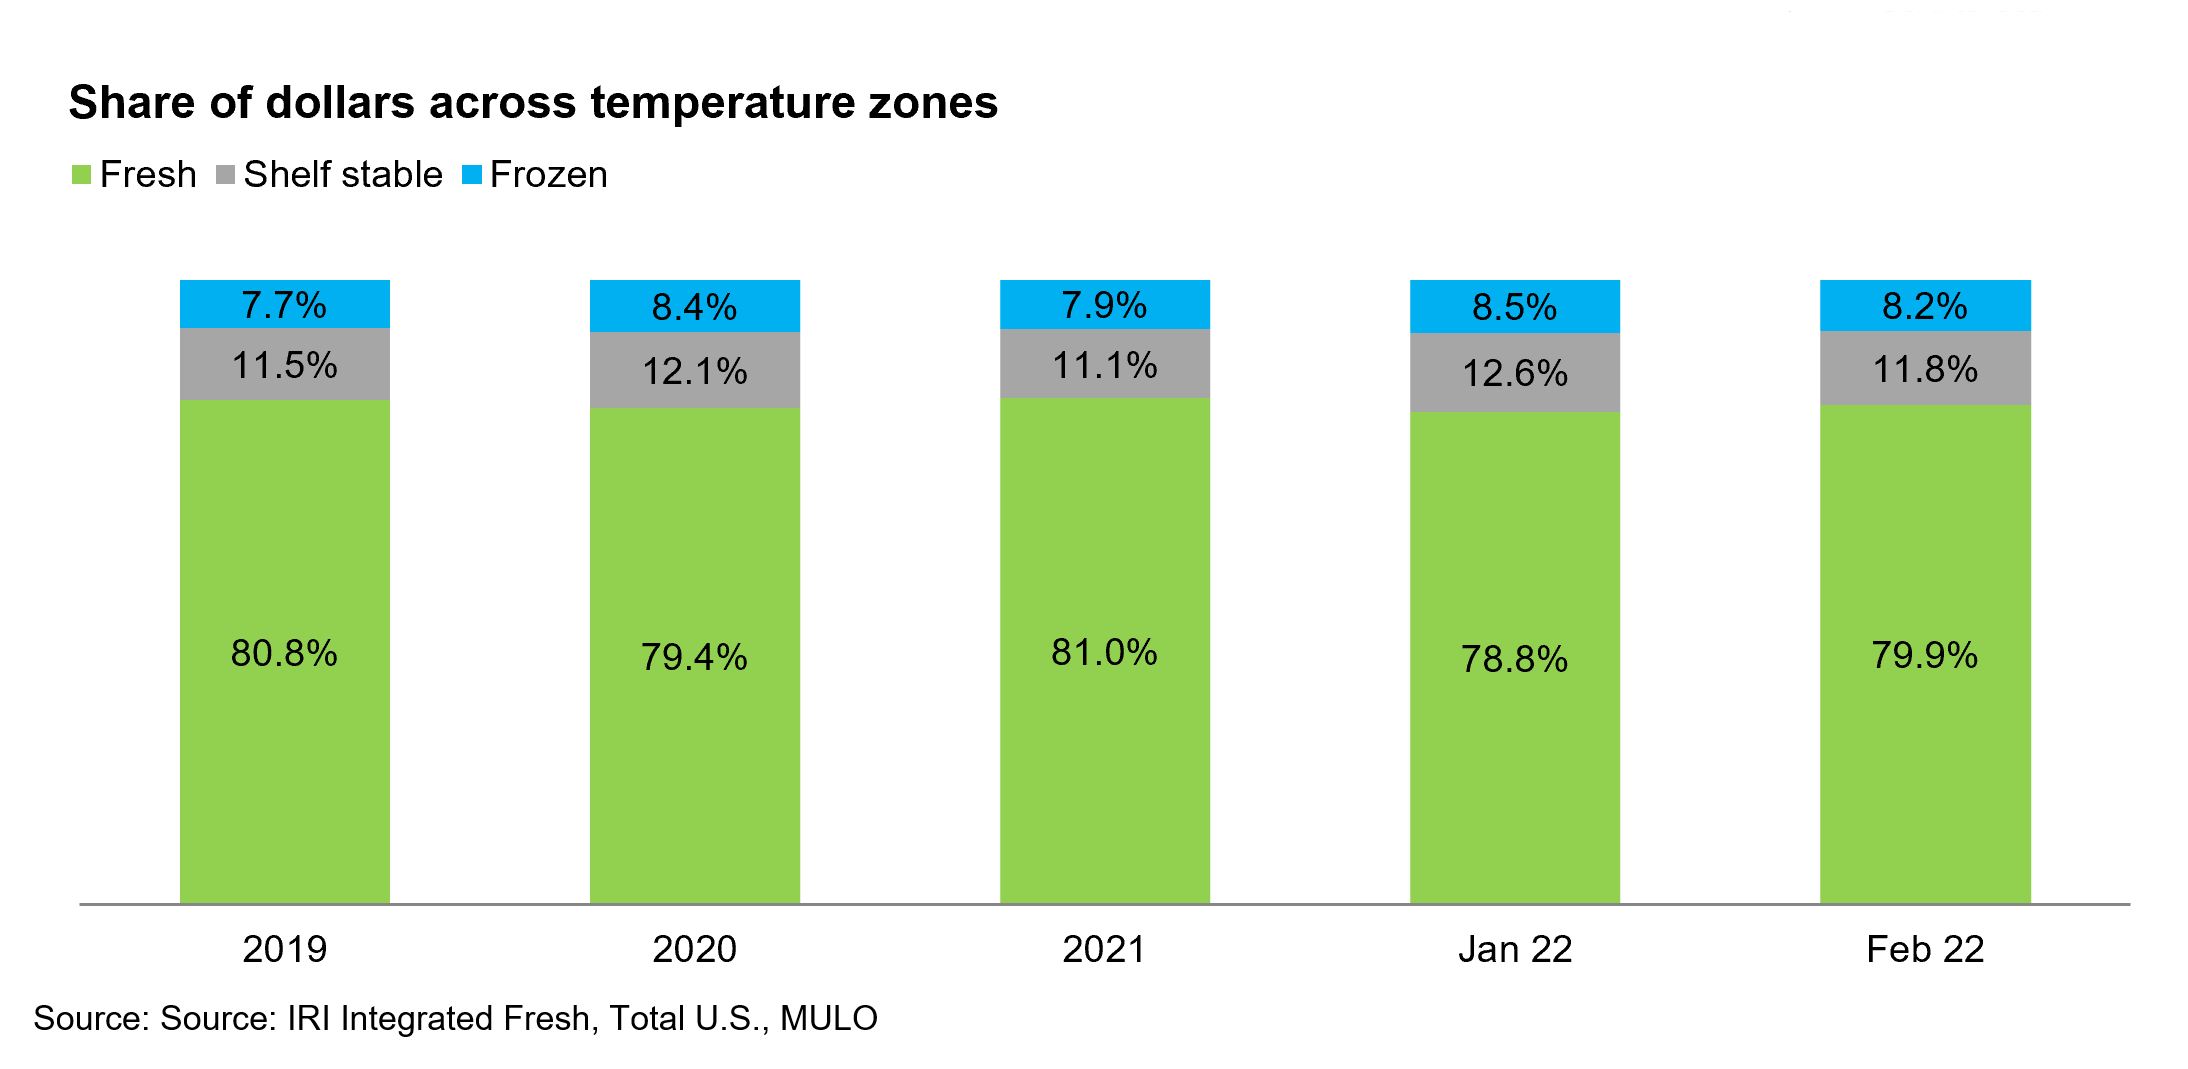
The February 2022 share of dollars for fresh produce was 79.9%, two points below its typical levels despite above-average inflation. As a share of total volume sold across frozen, center store and fresh, fresh produce made up 77.4%. Shelf-stable fruits and vegetables represented 14.4% of pounds in February 2022.

Fresh Produce Dollars versus Volume
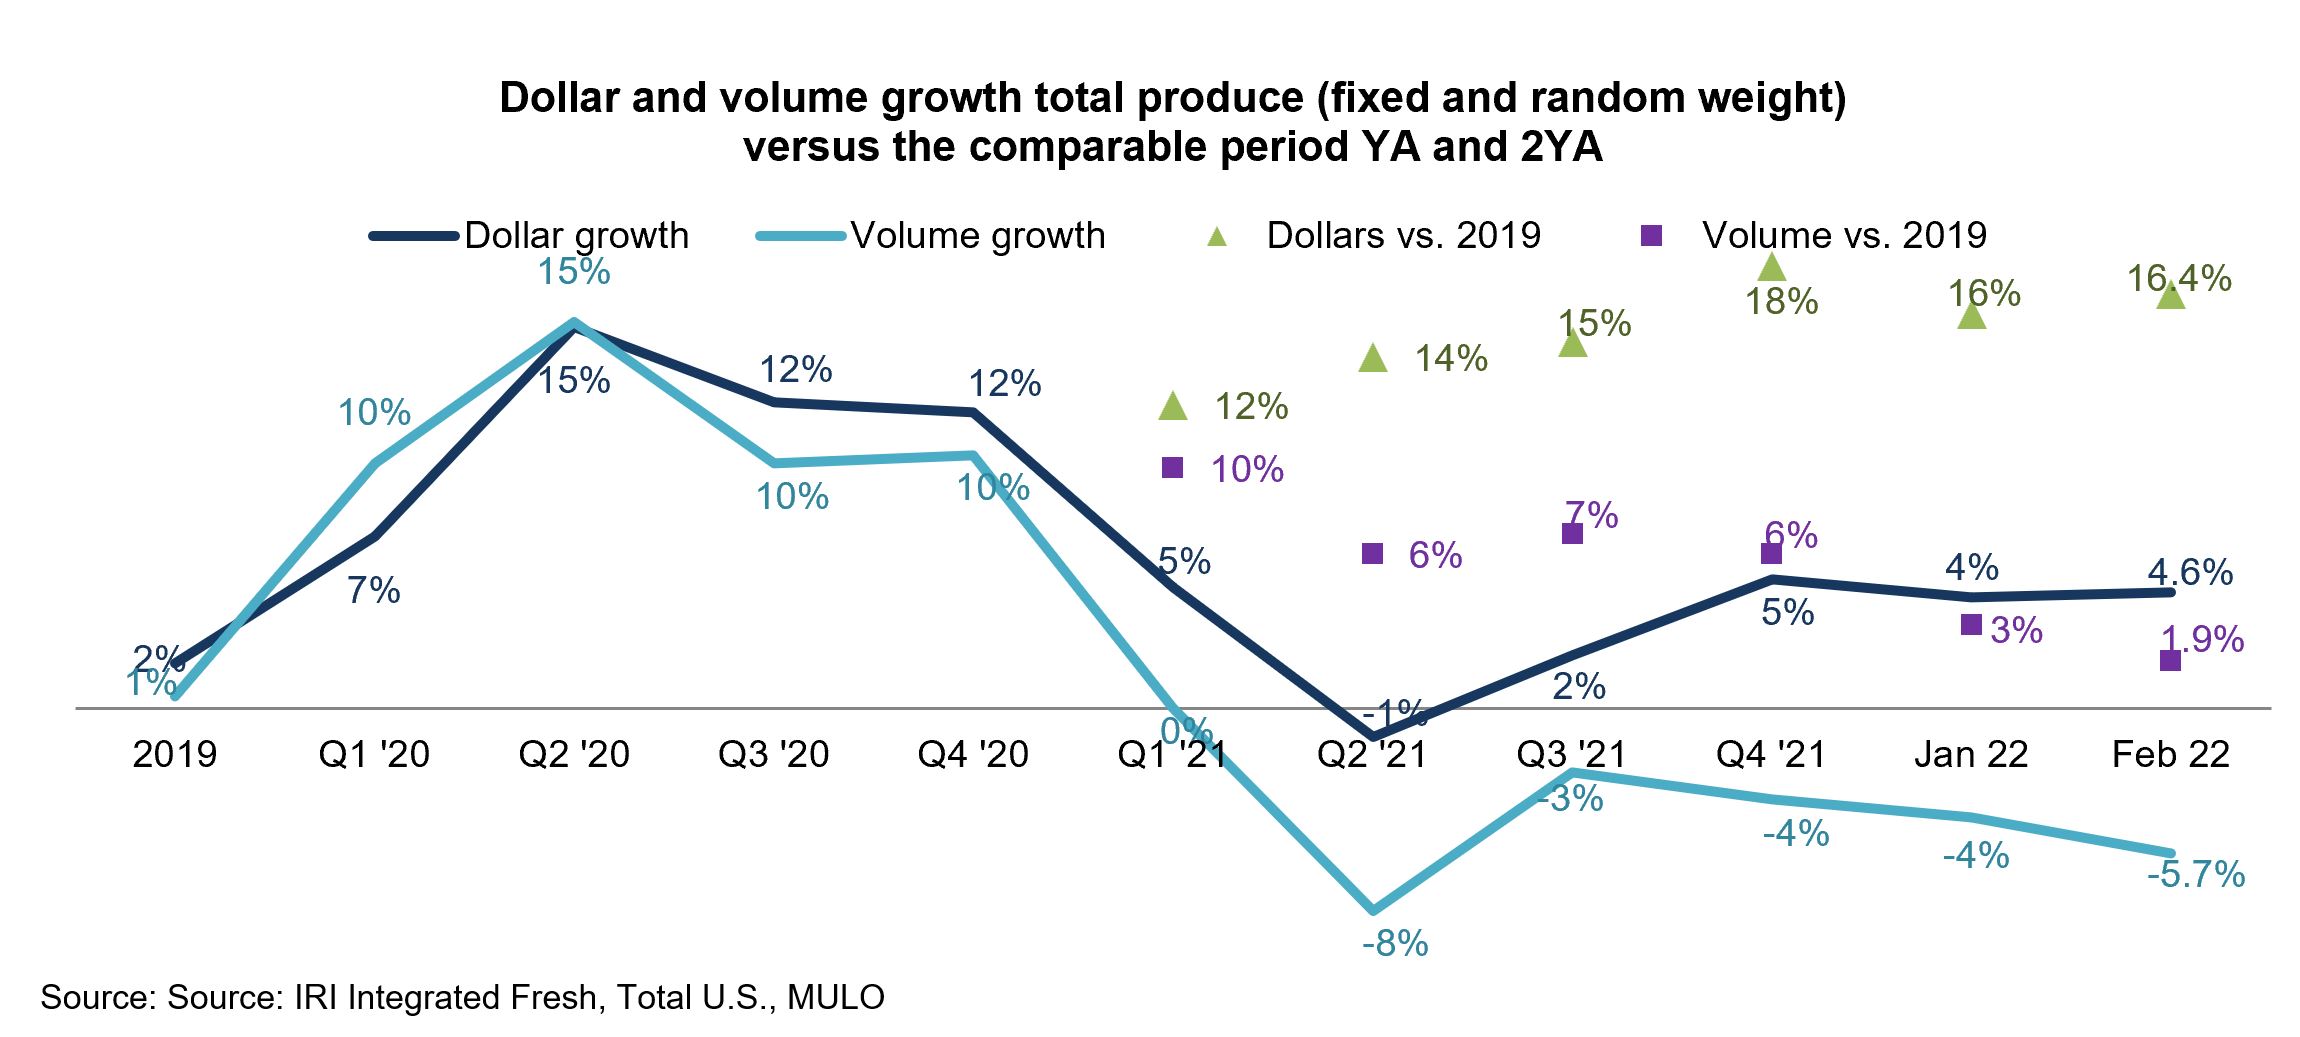
Fresh produce pound sales trailed behind year ago levels all throughout 2021. In January 2022, pound growth dropped to its lowest level since the second quarter of 2021 and the performance worsened in February. While dollars increased by 4.6%, volume dropped by 5.7%, creating a 10.3 percentage point gap between volume and dollars due to inflation as well as lower levels of promoting.

The inflationary impact is highest for fruit, with a 15-point gap between dollar and volume growth versus year ago.


Fresh Fruit Sales in February
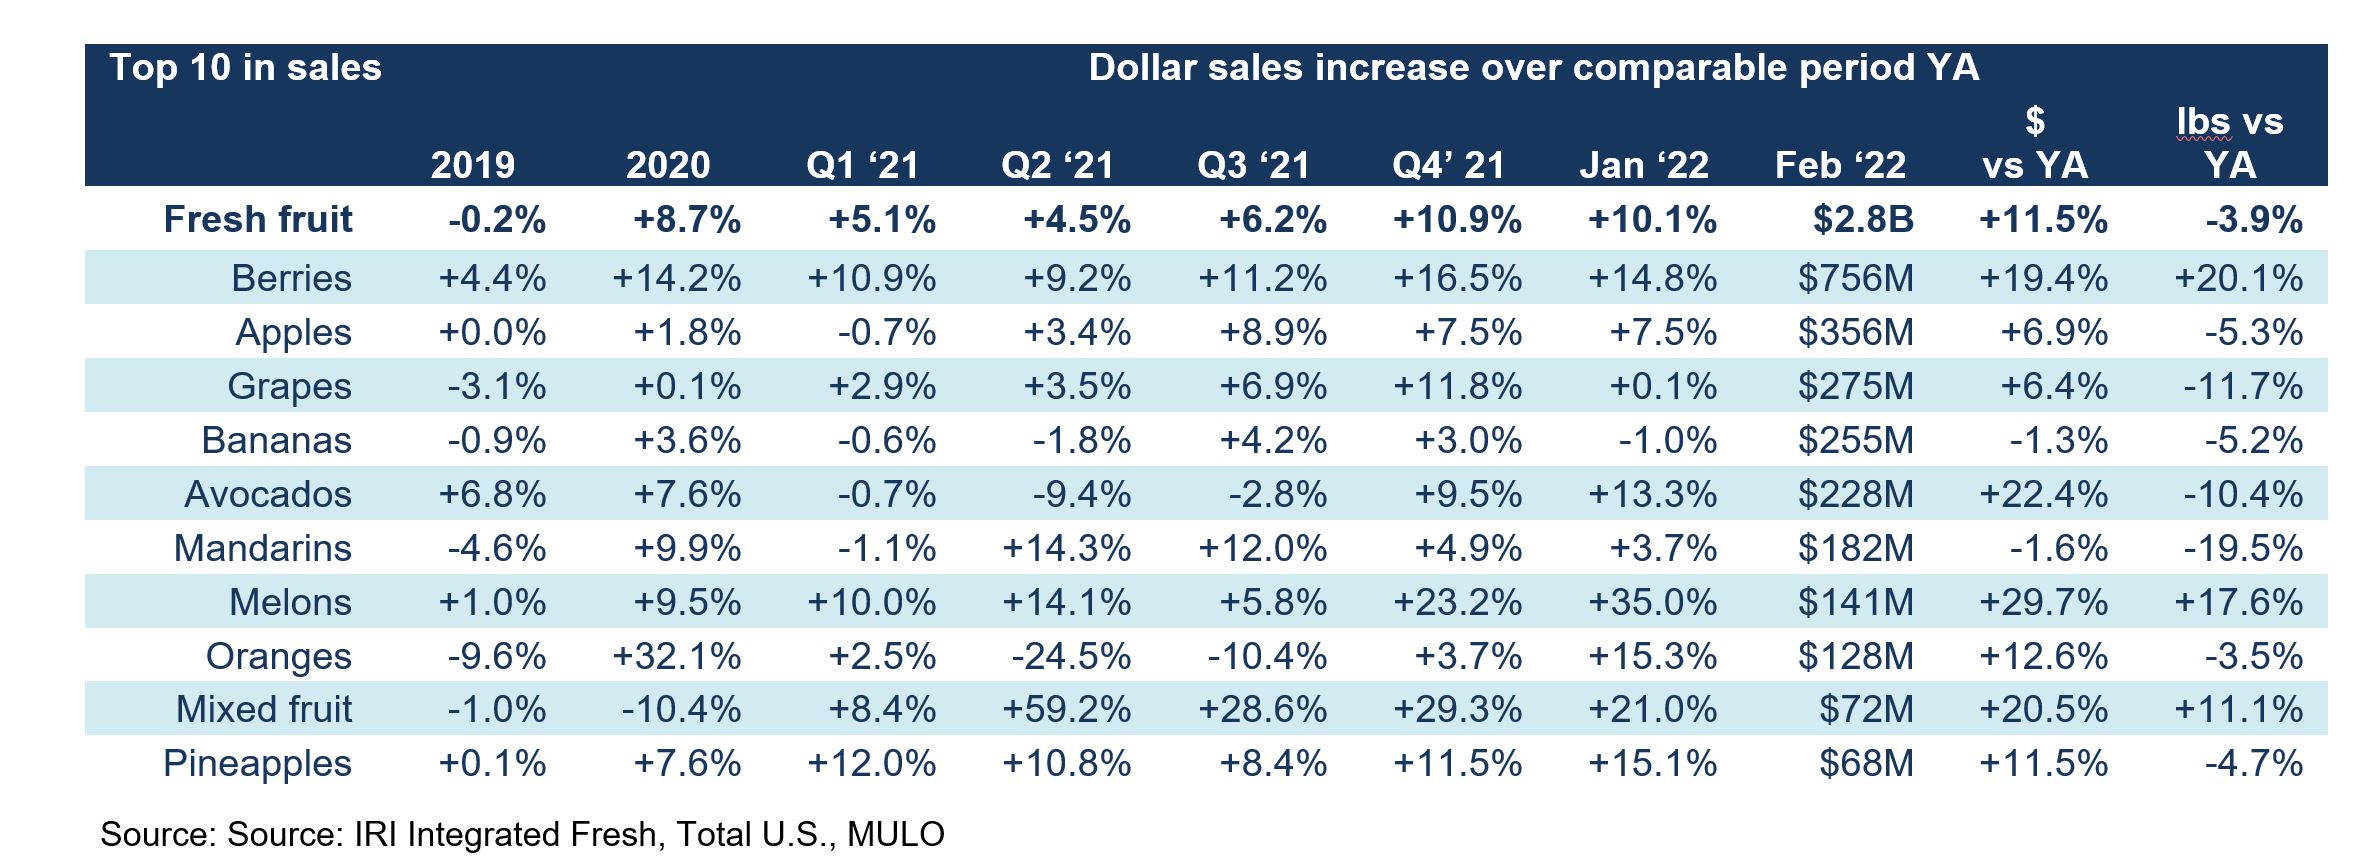
“On the fruit side, we had some shifts in the top 10 sellers in February,” said Parker. “While berries easily continued to dominate the top 10, grapes moved in third and avocados moved up to fifth. Pineapples replaced lemons as the 10th largest seller this month. Virtually all biggest sellers grew dollar sales versus year ago, with the exceptions of bananas and mandarins. Volume sales were a different story. Only berries and mixed fruit increased pound sales versus February 2021.”

Fresh Vegetables Sales in February
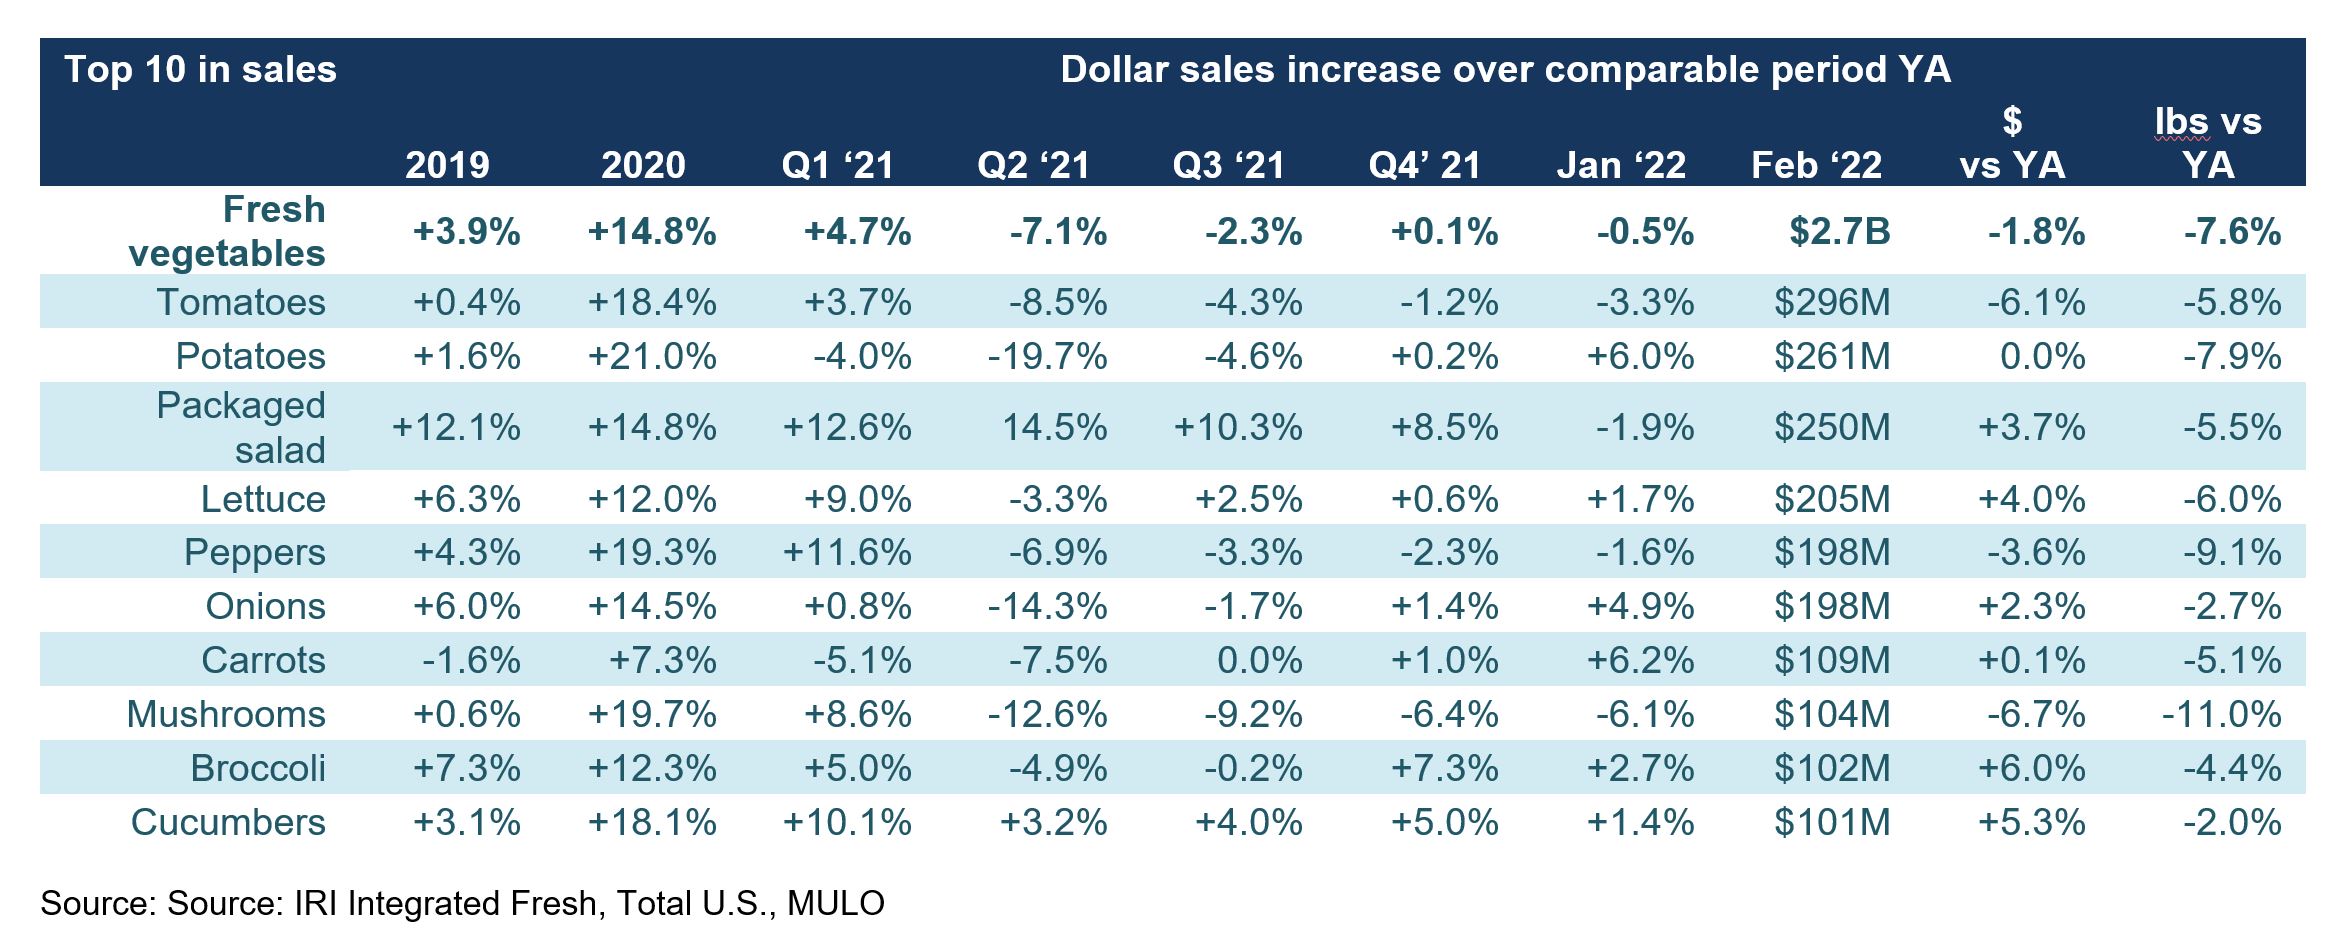
“The top 10 sellers on the vegetable side had a mixed performance but has been very consistent in makeup,” said Watson. “Pound sales versus year ago were down across the board, with onions coming closest to year-ago levels. Most areas did grow in dollars, with broccoli gaining the most, at +6.0% during the four February weeks versus year ago.

Fresh Produce Absolute Dollar Gains
“The top 10 in absolute dollar gains showed that smaller sellers, limes and mixed fruit, can still be big contributors to department growth,” said Parker. “But more than anything, it shows the impact of inflation. With the exception of mixed fruit and salad kits, all top 10 growth areas had double-digit inflation, led by much higher prices year-over-year for limes and avocados. Meanwhile, salad kits continue to be strong sellers, and I think at-home lunch is an important part of that. We still have a lot more people working from home today than we did pre-pandemic and our February survey showed that salads are among the top five things people make for lunch when at home.”


Perishables Performance
A look across fresh foods departments for the four February 2022 weeks shows perimeter strength in dollars with the exception of fresh seafood. Gains were highest for deli and bakery, followed by meat, whereas seafood sales continued to decrease.


What’s Next?
The marketplace disruption caused by inflation and supply chain challenges is not showing signs of letting up any time soon.
• At this time, inflationary levels have much greater impact on grocery shopping patterns than COVID-19 with 90% aware of the price increases and 96% extremely concerned, according to the IRI shopper research. This compares to only 31% of people being extremely concerned over Coronavirus as of February 2022.
• 45% of shoppers stocked up on certain items in February. Twenty percent did so as they were concerned it may not be available during future trips and 16% because they believe prices may be higher during their next visit.
• 81.7% of meals in February were prepared at home. This remains well above the July 2021 low of 77%.
• Nearly one-third of Americans, 32%, expect that their financial situation one year from now will look a little or a lot worse than it does today, whereas 45% believe it will be the same.
• 13% of trips were online in February, led by curbside pickup — which means 87% of trips were in-store, emphasizing the important role of produce in leading store choice. Only 4% of shoppers exclusively buy groceries online.


Easter Celebrations
• The share of consumers not planning a special Easter or Passover celebration dropped from 44% last year to 29% in 2022, though 21% have not yet made plans.
• Among those doing a special meal for their household or extended circle of family or friends, the average party size is expected to be slightly larger, at seven people.
The next report, covering March, will be released in mid-April. In addition to the data provided here, the IFPA also now offers InSite – an online interactive data set covering both produce and floral performance as well as a look at the 2021 consumer sentiment surveys. See www.freshproduce.com for more detail. We also encourage you to contact Joe Watson, IFPA’s VP, Retail, Foodservice and Wholesale, at jwatson@freshproduce.com with any questions or concerns. Please recognize the continued dedication of the entire grocery and produce supply chains, from farm to retailer. #produce #joyoffresh #SupermarketSuperHeroes.
Date ranges:
2019: 52 weeks ending 12/28/2019
2020: 52 weeks ending 12/27/2020
Q1 2021: 13 weeks ending 3/28/2021
Q2 2021: 13 weeks ending 6/27/2021
Q3 2021: 13 weeks ending 9/26/2021
Q4 2021: 13 weeks ending 12/26/2021
January 2022: 5 weeks ending 1/30/2022
February 2022: 4 weeks ending 2/27/2022


