Editor’s note: click charts to enlarge.
After weeks of growing transactions and spending in the foodservice channel, the rising number of COVID-19 cases around the country prompted many states to reinstate in-restaurant dining restrictions and limit capacity once more. Hand-in-hand with rising consumer concern, limited restaurant engagement caused dollars to shift back to the retail channel across food categories, including fresh produce.
Retail food sales increased 13.7% versus year ago during the week ending July 19 — its highest gain during a non-holiday week since mid-May. 210 Analytics, IRI and PMA partnered to understand fresh produce sales at retail throughout the pandemic.
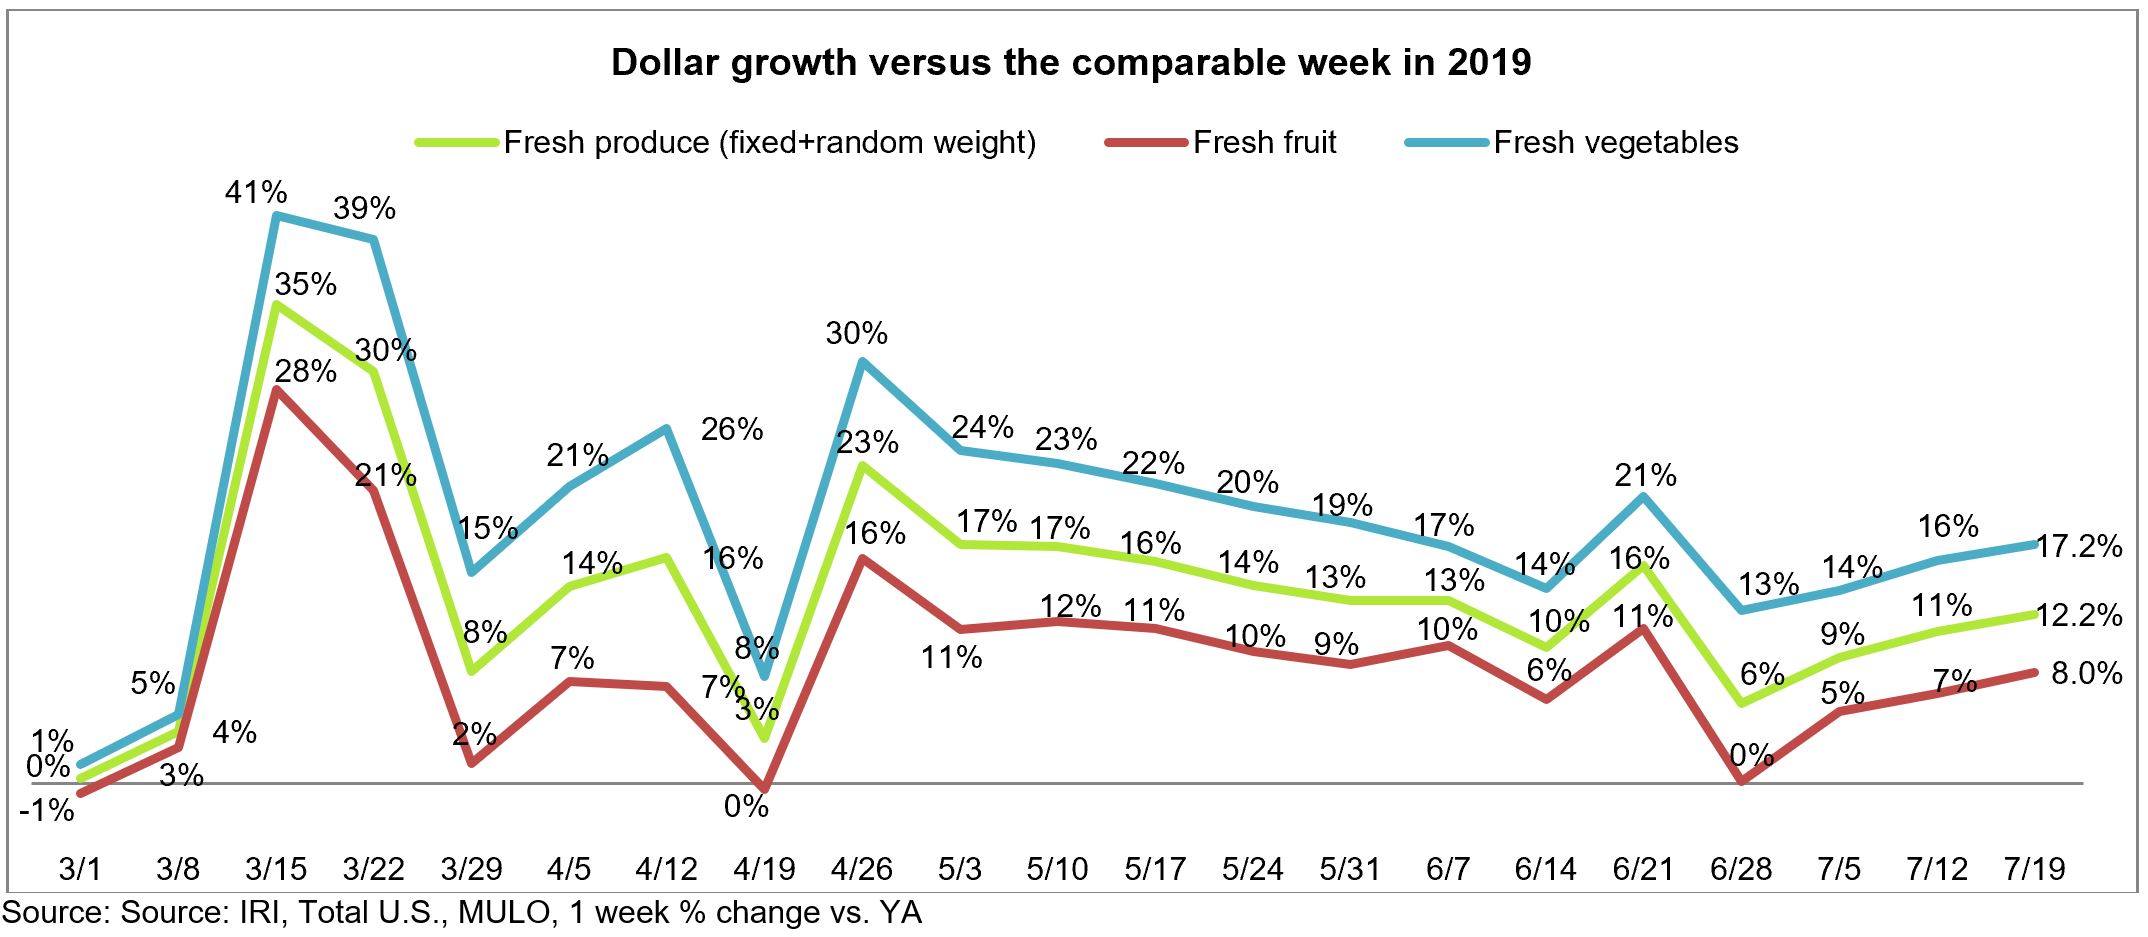
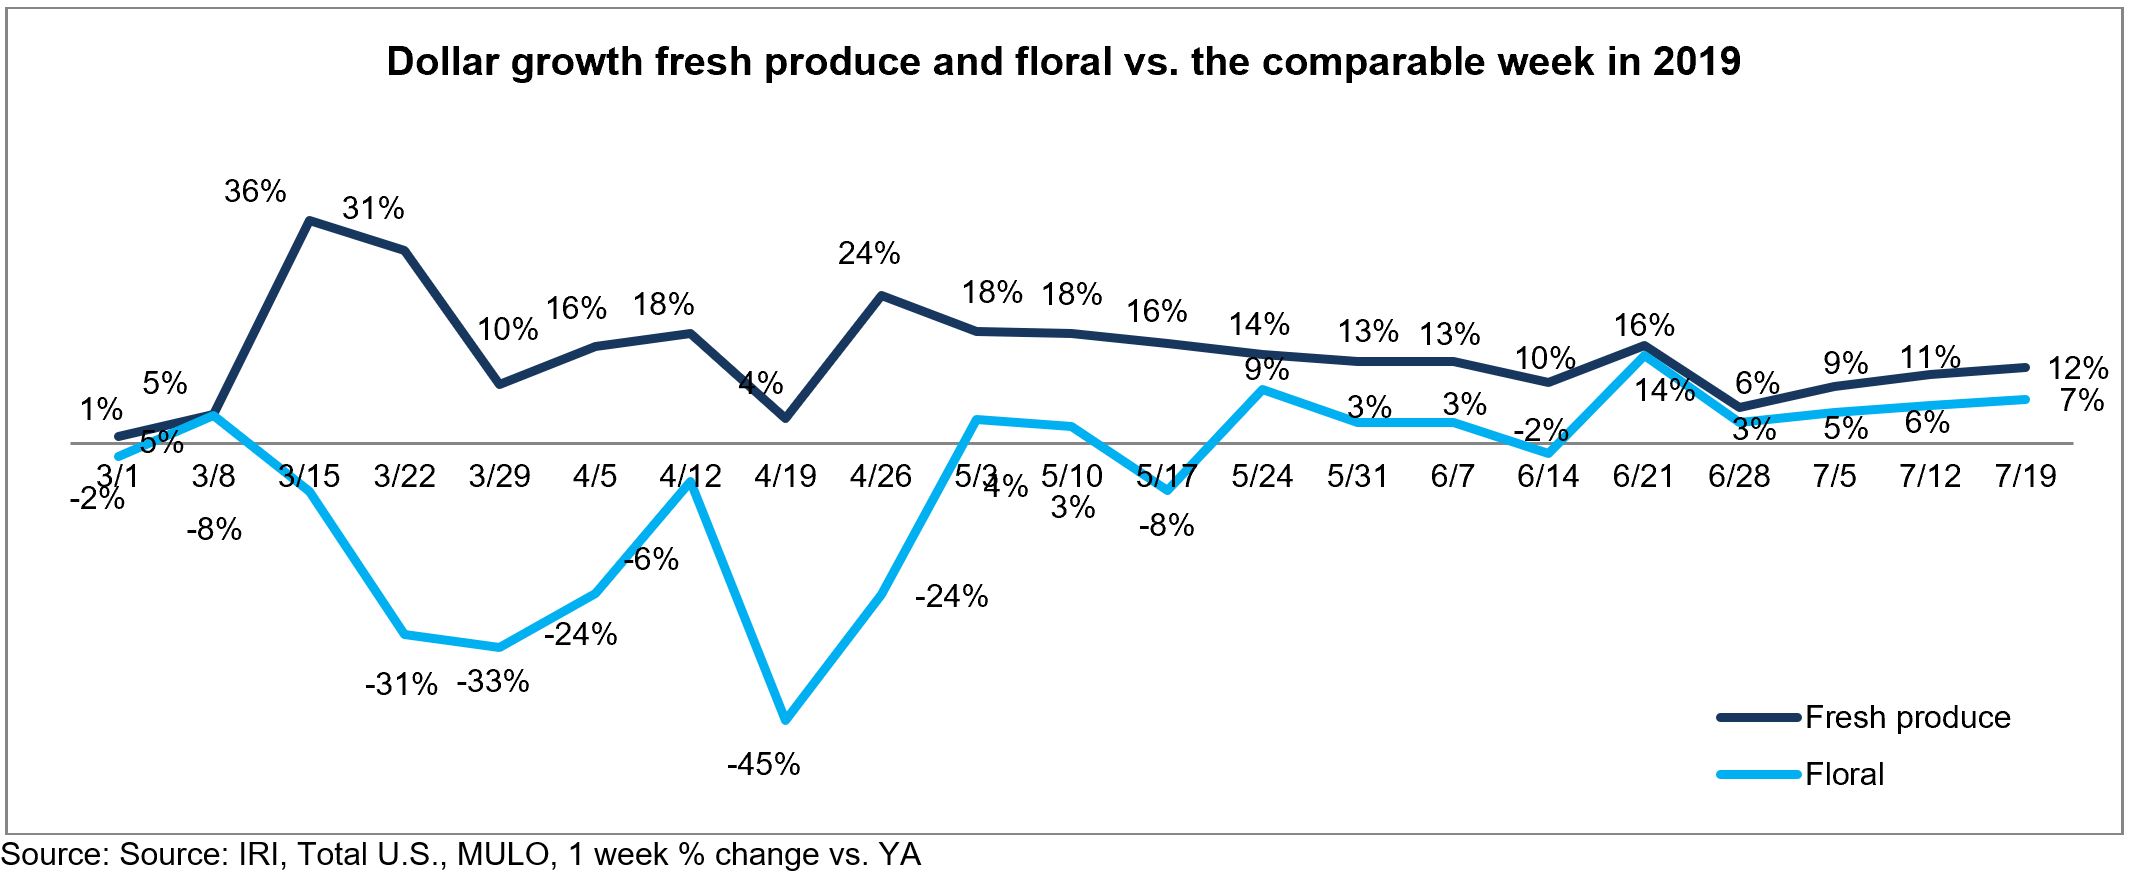
Elevated every day retail demand drove sales gains of 12.2% over year ago for fresh produce during the week ending July 19 — the highest in several weeks. Frozen and shelf-stable fruits and vegetables had higher percentage gains but off a smaller base, with particular strength for frozen, at +27.3%. Year-to-date, produce department sales are up 10.9% over the same time period in 2019. Frozen fruit and vegetables increased the most, up 27.9% year-to-date. This is in spite of limited assortment of frozen vegetables and fruit, down -7.9% in average items per store selling.
“It is becoming increasingly evident that the virus controls much of how market forces will develop in the coming weeks and months ,” said Joe Watson, VP of Membership and Engagement for the Produce Marketing Association (PMA). “The rise in COVID-19 cases is prompting renewed spending at retail, with everyday demand generating double digit increases over year ago. But the devastating part is that this is at the detriment of foodservice produce sales. Everyone in the produce supply chain benefits from balanced retail and foodservice demand and this second hit is devastating.”
Fresh Produce
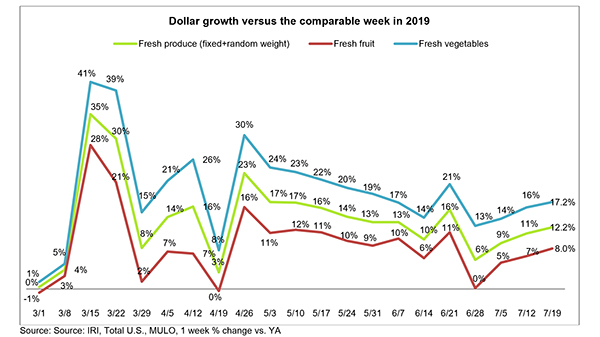
Fresh produce generated $1.41 billion in sales the week ending July 19 — an additional $154 million in fresh produce sales. Vegetables, up 17.2% from the prior year, had a 9.2 growth percentage point lead over fruit. Father’s Day excepted, fruit had its strongest week since mid-June, at +8.0% over last year.
“The fresh departments had a strong week, led by meat and seafood,” said Jonna Parker, Team Lead, Fresh for IRI. “And if we take a closer look at the produce department, fresh vegetables had above-average growth as well. All these areas have one thing in common and that is supporting at-home meal occasions. Early on in the pandemic, our weekly survey of shoppers found that nine in 10 meals were prepared at home. That number had started to drop as people re-engaged with foodservice, but is rising once more. Americans are not used to cooking all meals, all week and I suspect the big difference this time is the quest for convenience-focused solutions, including value-added produce.”
Fresh Share
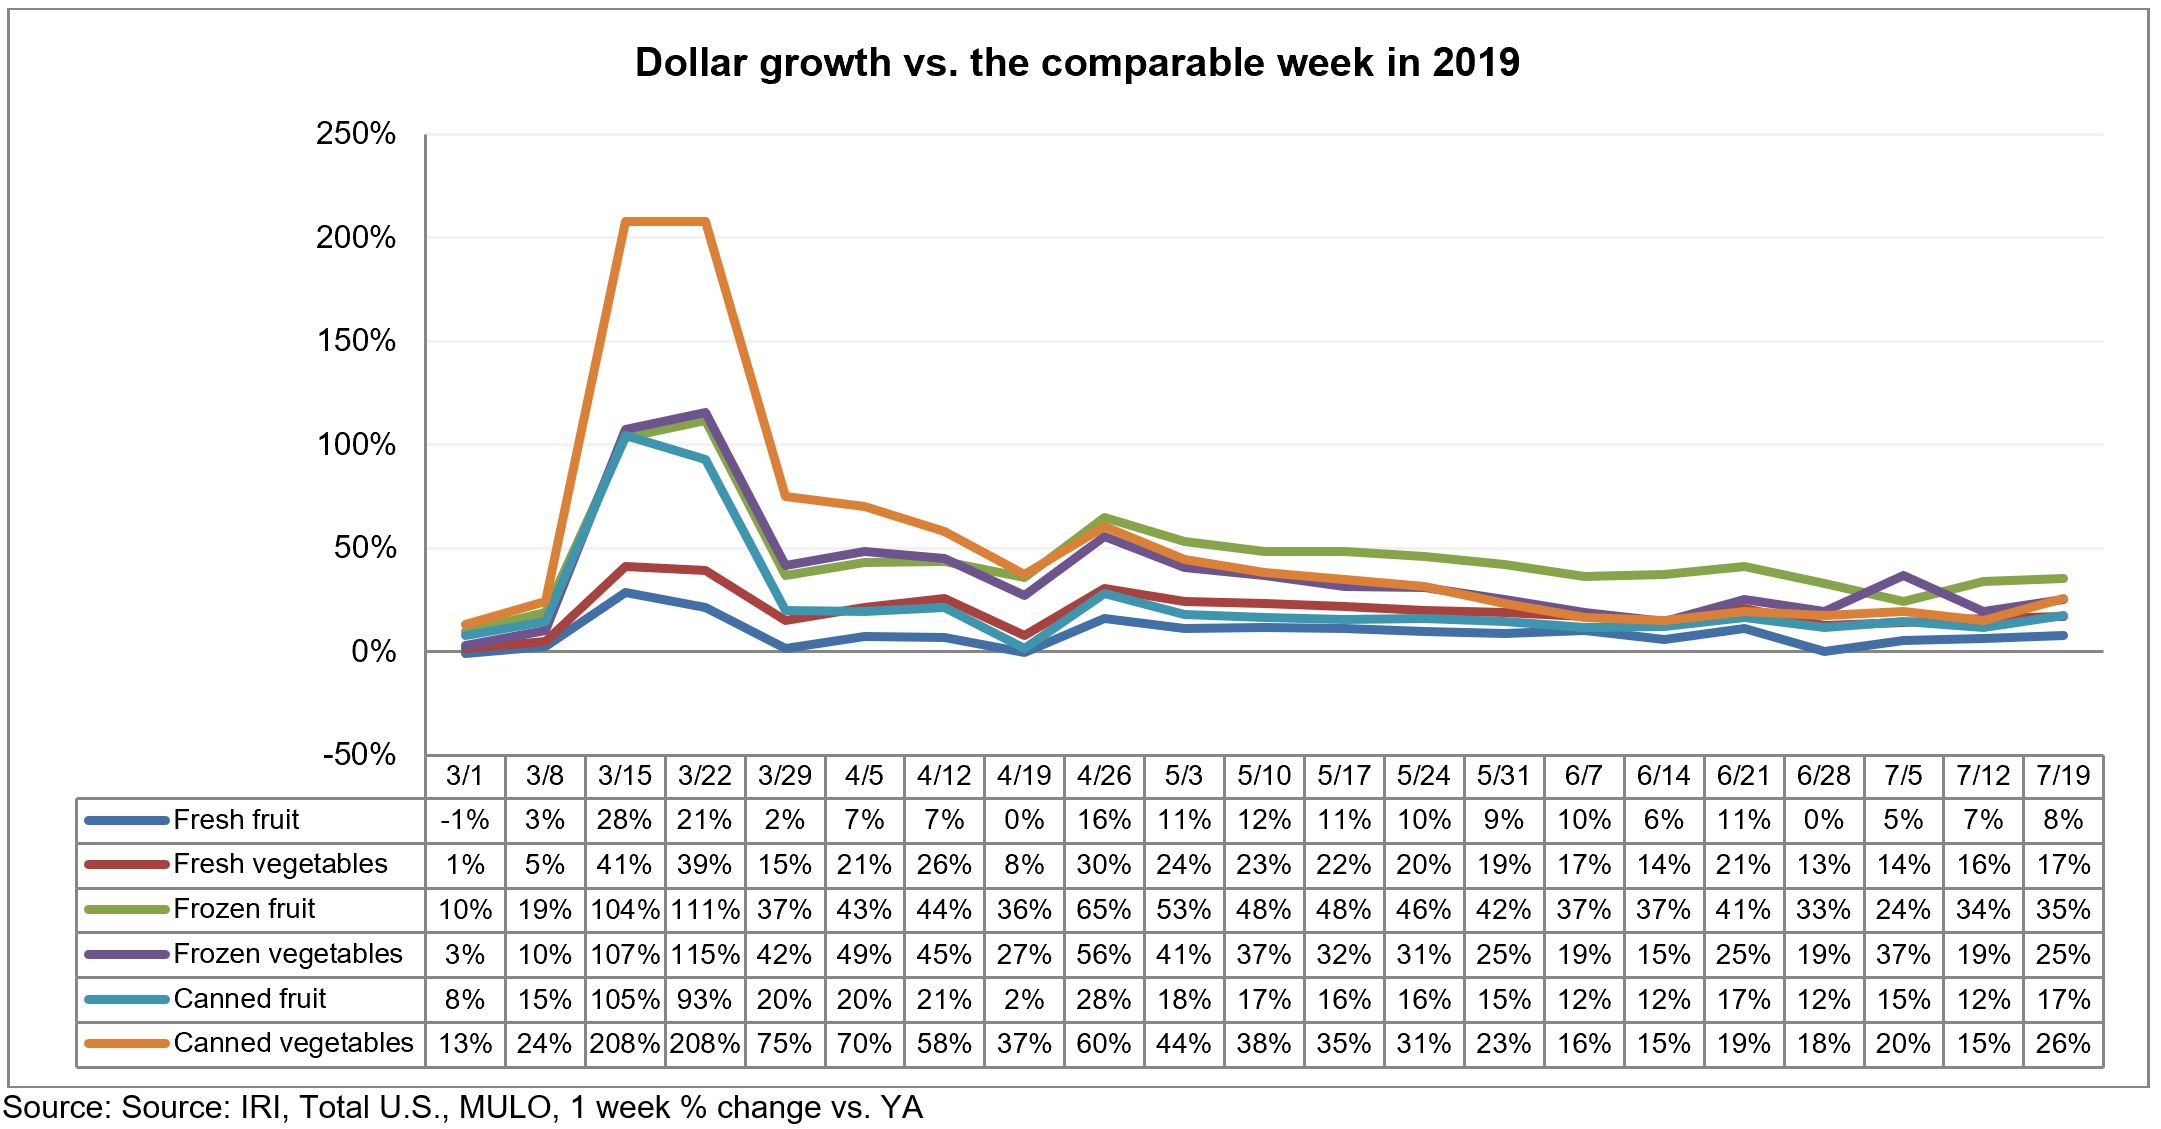
During the height of the pandemic stock up purchasing, the fresh share of total fruit and vegetable sales fell to as low as 70%. Every week, fresh produce gained back a point or two to return to its 2019 share of 84% during Independence Day week, typically a big fresh produce holiday.
However, as COVID-19 cases are rising, so is the share of frozen fruits and vegetables and fresh’ share backslid one more point to 82%.
“Early on we saw that consumers engaged with frozen and canned fruits and vegetables to have a stock at home to make it through the week and limit store visits to just one trip a week ,” said Watson. “This also prompted consumers to purchase fresh produce items with longer shelf life and consumers may not see summer fruits in that light. One of our biggest opportunities right now is to highlight fresh items for immediate consumption versus items that will last until the end of the week.”
Fresh Produce Dollars versus Volume
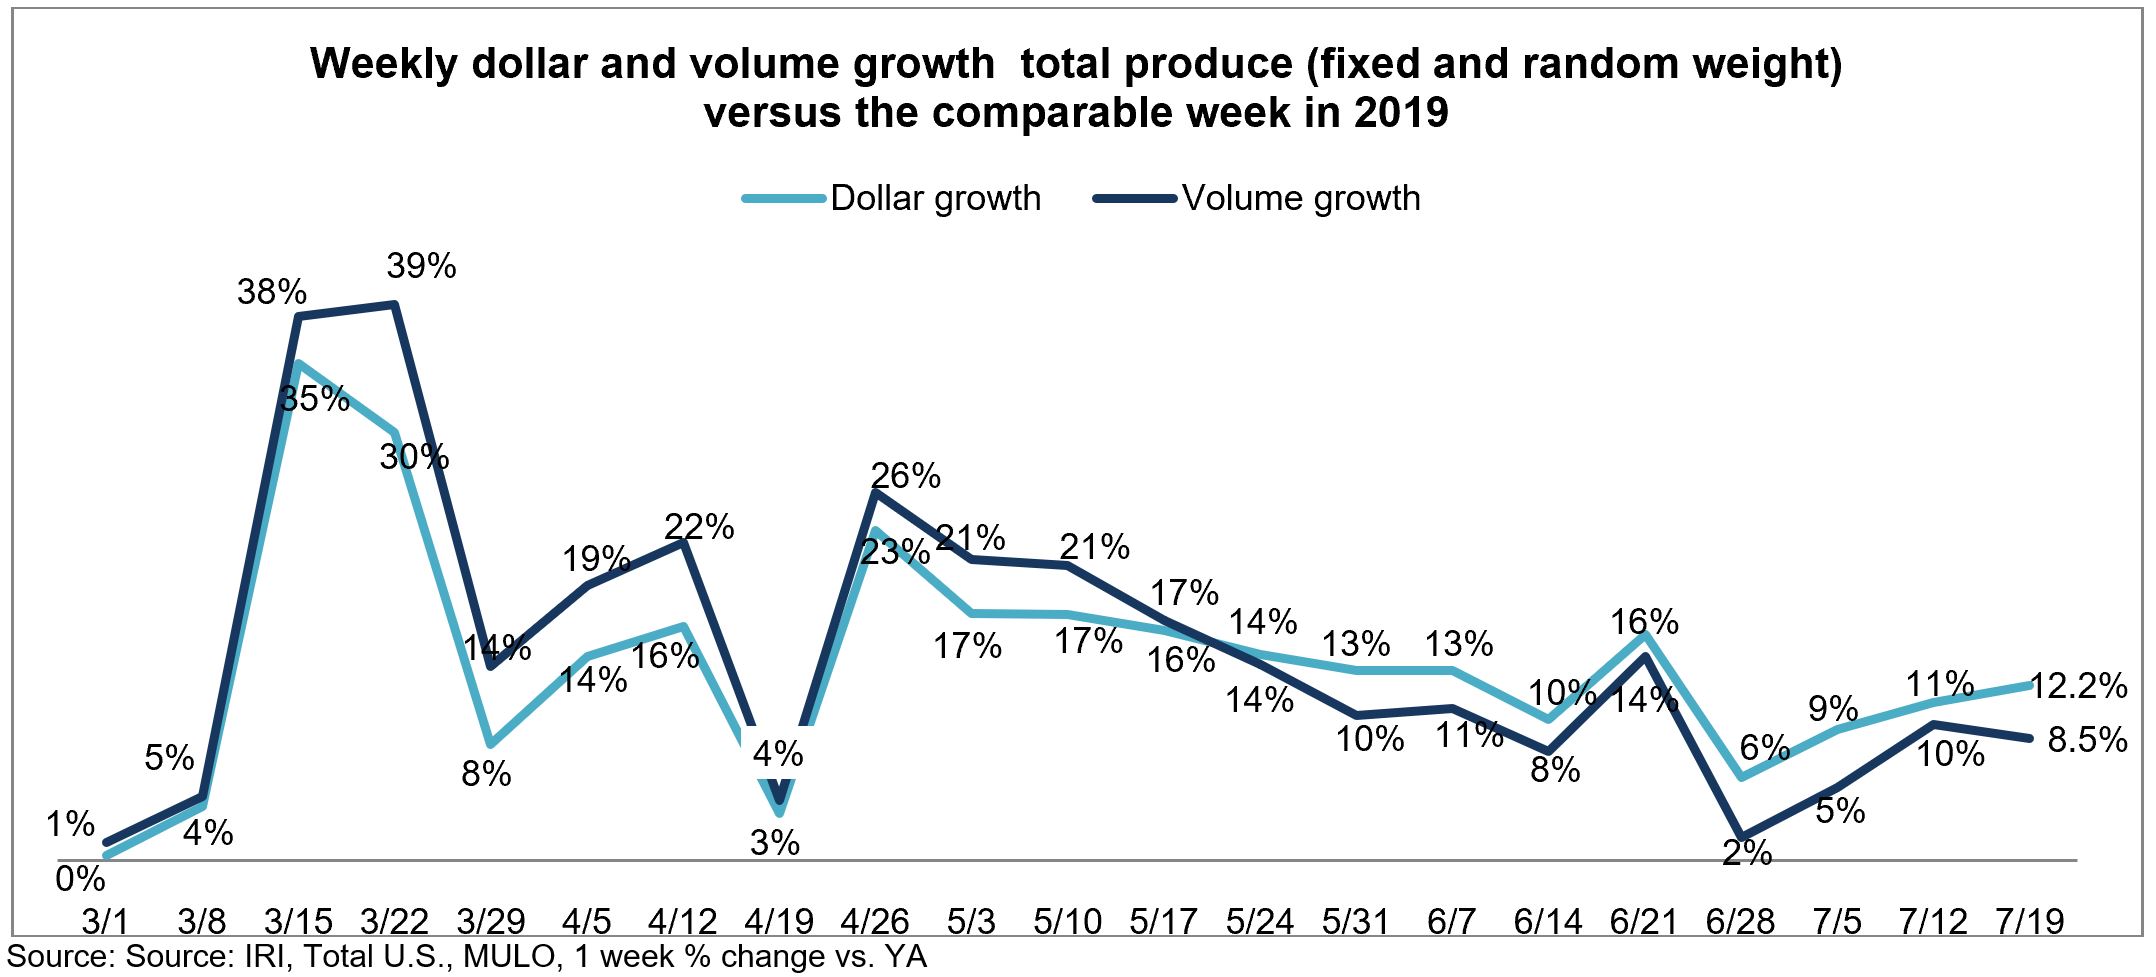
After narrowing to just 1.5 percentage points during the second week of July, the volume/dollar gap widened to 3.7 points. However, the overall view is a bit misleading with many areas seeing double-digit inflation or deflation.
Both fruit and vegetables saw dollar sales gains track ahead of volume gains. Fruit volume gained 3.9% over the same week last year, showing demand is up but not quite keeping pace with other foods. In vegetables, dollar gains also outpaced volume, at +17.2% versus +15.7%. The volume/dollar gap remained virtually unchanged at just 1.5 points.
However, moving from total fruit and vegetables to the individual categories show that supply and demand is still significantly out of balance for many areas. Ample supply is driving higher volume than dollar gains for items such as avocados, celery, pineapples and grapes. On the other hand, dollar gains are far outpacing volume for items such as corn, cherries, asparagus, melons, mangoes and limes.
Absolute Dollar Gains
Cherries contributed $15.1 million in new dollars the week of July 19 versus the comparable week in 2019. Tomatoes and lettuce contributed $14.2 and $13.4 million, respectively.
“Cherries took back over as the number one in absolute dollar gains, showing summer fruits have not lost their impulse power amid the pandemic,” said Watson. “All summer offerings delivered strongly this week, including melons, berries and corn. We continue to see unbelievable results for oranges, still above 50% versus year ago and an important lesson to highlight nutritional benefits as consumers seek to build their immune systems.”
Fresh Fruit
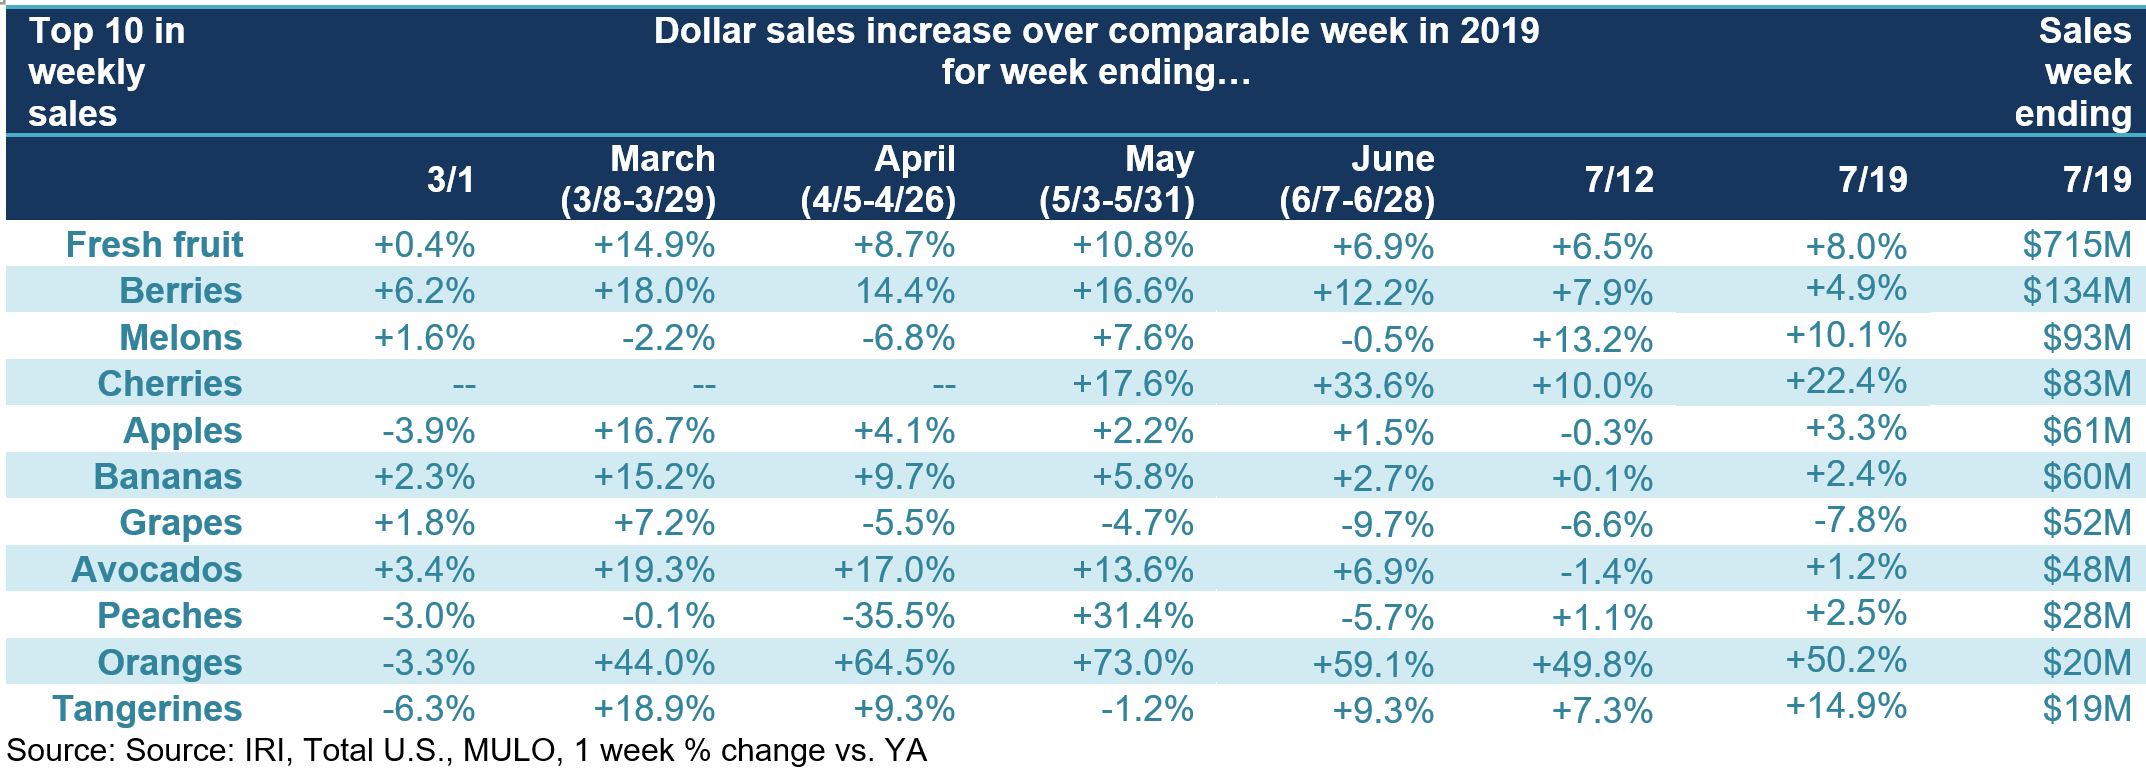
“In fruit, berries are an incredible powerhouse dominating sales week after week with very little help from inflation,” Parker said. “We continue to see a mix of summer fruits and items with longer shelf life, such as apples, oranges and tangerines. Melons and cherries had a strong week once more, but we have to keep in mind that prices drove much of the dollar gains with increases of 16.6% and 22.7% in price per pound versus year ago for melons and cherries, respectively. Demand for avocados is strong, but dollar gains were pulled down by prices being down 32.1% versus year ago. The bottom line: fresh fruit cannot rely on impulse alone and will need to drive planned purchases through favorable features and social media outreach.”
During the week of July 19, double-digit gains were reserved for melons, cherries, oranges and tangerines, with the highest percentage growth yet again going to oranges, at +50.2%. Sales of grapes continued to track in negative territory versus year ago, in part due to deflationary conditions.
Fresh Vegetables
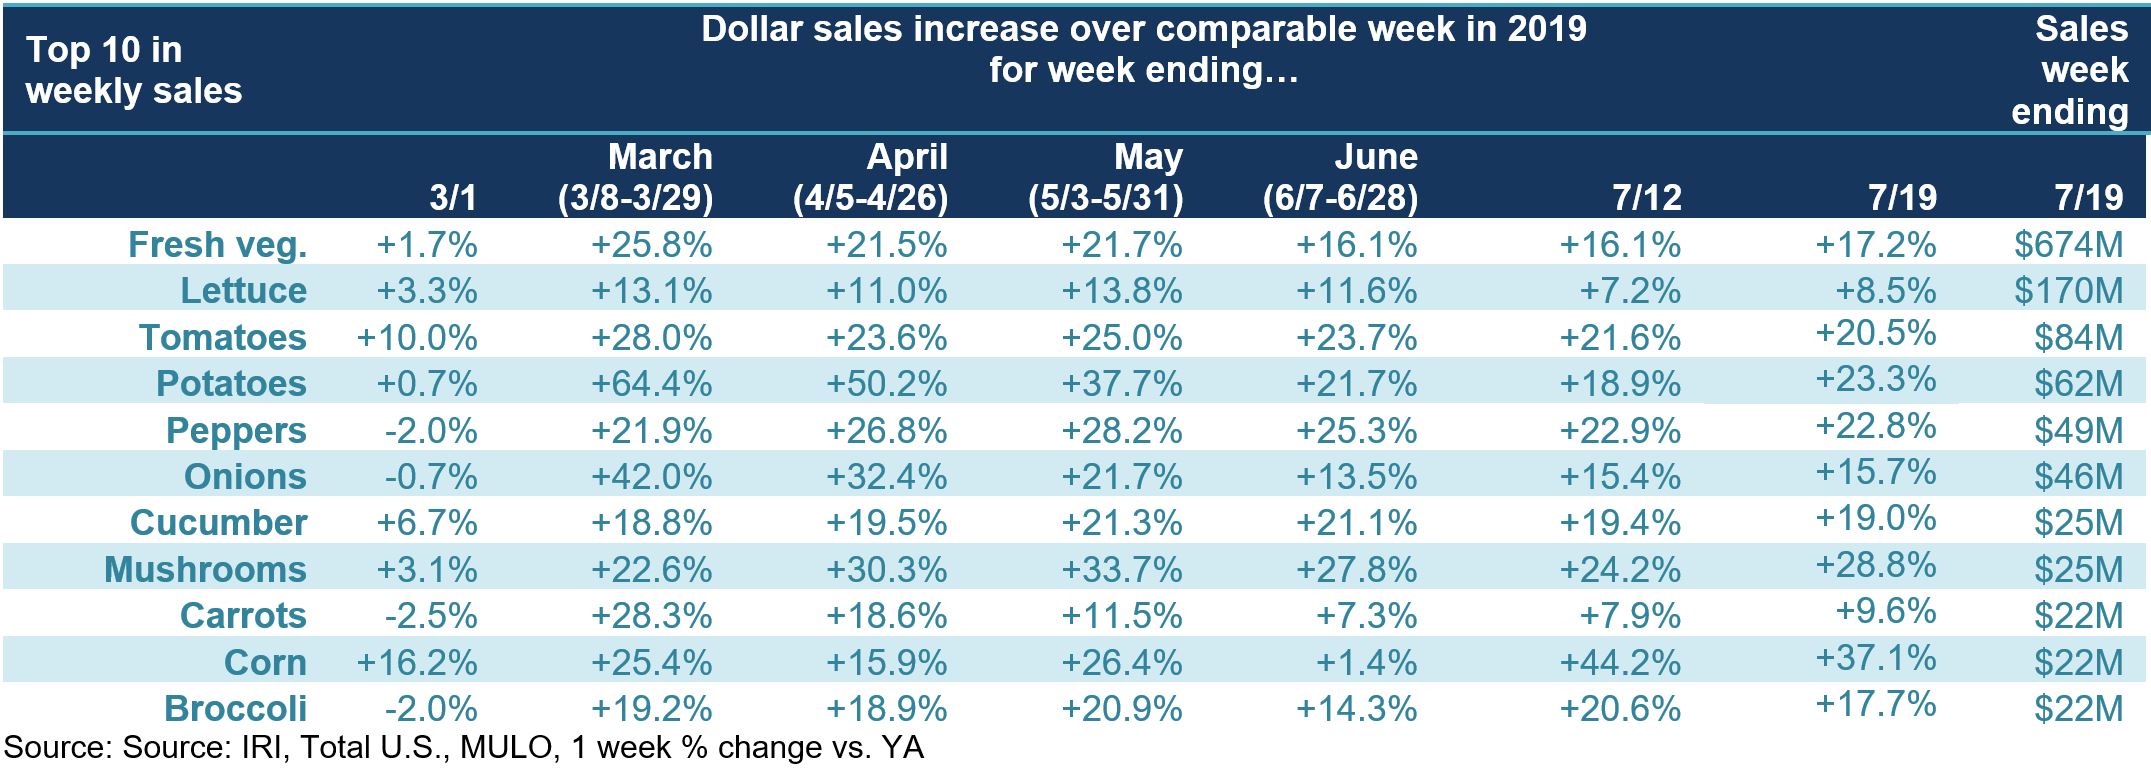
“In contrast to fruit, all top 10 vegetables increased in dollar sales versus year ago and eight in 10 did so with double-digit gains,” Watson said. “Whereas the order and items in the top 10 for fruit are very different each week, vegetables has virtually the same line up each week with just a few items shuffling up or down. Lettuce is the dominant seller, more than twice the size of number two, tomatoes, yet up 8.5% versus the same week year ago. The highest weekly gain percentage goes to corn, at +37.1%. Much of this increase was fueled by price increases, with volume up 10.7%.”
Dollar gains for fresh cut salad jumped back into double digits, at +10.1%. Volume sales increased 5.9%. “Consumers have a long history of mixing and matching semi- and fully-prepared items with items they cook from scratch,” said Watson. “Fresh-cut lettuce is ideally positioned to address the cooking fatigue many consumers are experiencing and can be leveraged for cross-merchandising with items like rotisserie chicken or ready-made sides for an easy dinner or lunch.”
Fresh Versus Frozen and Shelf-Stable Fruits and Vegetables
All temperature states of fruit and vegetables had double-digit gains during the week of July 12, with the exception of fresh fruit. Frozen fruit had particularly high gains this week, at +35%. The continued strength of frozen fruits and vegetables goes hand-in-hand with strong frozen foods performance overall. The renewed surge in canned vegetables shows the impact of virus-related shopping with consumers stocking up once more.
Floral
Floral sales at retail had another strong week, up 6.6% over the same week last year. With the exception of the week of June 14, sales have been in positive territory since the third week of May.
Perimeter Performance
The fresh perimeter did well during the week ending July 19 with total gains of 13.2% versus the same week last year. Produce’s performance was just a little below the fresh average, that was pulled up by meat, at +23.4%. Center-store edible gains topped those of fresh and total store, at +17.3%.
What’s Next?
This was the second of eight non-holiday weeks until Labor Day in which everyday demand alone has to drive growth. As virus cases are mounting around the country, retail demand is growing once more, produce included. Between the rising COVID-19 concern among shoppers and the economic pressure, produce dollar sales are likely to track ahead of 2019 for the foreseeable future.
Please recognize the continued dedication of the entire grocery and produce supply chains, from farm to retailer, on keeping the produce supply flowing during these unprecedented times. #produce #joyoffresh #SupermarketSuperHeroes. 210 Analytics and IRI will continue to provide weekly updates as sales trends develop, made possible by PMA. We encourage you to contact Joe Watson, PMA’s Vice President of Membership and Engagement, at jwatson@pma.com with any questions or concerns.


