The March Marketplace
Inflation has reached a 40-year high and consumers are extremely aware.
“In March 2022, IRI’s survey of primary shoppers found that 92% of consumers believe food prices are somewhat or a lot higher than last year, of whom 95% are concerned about it,” shared Jonna Parker, Team Lead Fresh for IRI. “This includes 49% who are extremely concerned, which is far greater than the 27% of consumers being extremely concerned over coronavirus in this same survey. This means that inflation has a far greater grip on the nation’s food spending than COVID-19 in the current marketplace.”
The inflationary levels are prompting a range of money-saving measures among 72% of consumers. “While shoppers tried to combine all grocery needs into one store, one trip in the past few years, 17% of consumers now visit multiple retailers to get the best deals,” added Parker. “Switching stores is typically one of the very last measures shoppers take in order to save, but clearly the widespread nature and the level of inflation are such that even an extra trip to capitalize on lower prices or promotions is worth it. Others, especially lower-income shoppers, are leveraging online shopping as a money-saving measure given the ease of comparing prices and promotions across stores and the ability to monitor the total spend easily as items are added to the online basket.”
More commonly, 48% of consumers are looking for sales promotions. However, in the volatile market both the frequency of promotions and the depth of the discounts are down significantly versus pre-pandemic across departments. Other popular money-saving measures are cutting back on non-essentials (36%), looking for coupons (30%), simply buying less (26%) or switching to private-brands (21%). “These measures have resulted in prolonged unit and volume pressure across most categories, while dollar sales are boosted by inflation,” said Parker. Fresh produce sales are no exception. To document the ever-changing nature of the marketplace, IRI, 210 Analytics and IFPA continue to team up to bring the latest trends and analysis relative to the produce department.
Inflation Insights
The price per unit across all foods and beverages in the IRI-measured multi-outlet stores, including supermarkets, club, mass, supercenter, drug and military, increased an average of 10.3% in the four weeks ending March 27, 2022 (“March”) versus the same four weeks in 2021. Prices rose 9.9% during the first quarter of 2022 top of the 5.5% of the first quarter in 2021. After many months of accelerated numbers, the inflation rate of +10.3% in March held steady at the rate seen in February.
Fresh produce prices are also up from last year, at +10.1%, which is right in line with total food and beverages. In March 2022, the price per pound for total fresh produce reached $1.89. The latest 52-week look was lower, at $1.72, given the much milder inflation in the second quarter of 2021. Fresh vegetable inflation was far below average, at +7.0% in March, contrary to fruit, at +13.3%.
“While the March increase of 13.3% is certainly concerning, there is some measure of good news in that the rate of inflation no longer accelerated but actually moderated a bit,” said Joe Watson. “Inflation jumped +16.1% year-on-year in February 2022 to an average of $1.92 per pound. In March, the average price per unit across fruits and vegetables was $1.89. I talk to many retail produce professionals around the country and they remain positive going into the mid-spring and summer seasons. While most agree that the elevated cost of transportation will persist, and possibly even be higher for products coming out of the Western USA growing regions for the remainder of 2022, the more regional crops coming into production could lessen the burden of high freight costs.”

March 2022 Sales
The four March 2022 weeks brought $54.3 billion in total food and beverage sales, which was down from $55.5 billion in February. Compared with March 2021, dollars increased 6.0% and compared with pre-pandemic, March sales were up 22.3%. However, against the giant spikes of March 2020, sales were down 12.0%.
Inflation played a significant role with year-on-year unit sales down 3.9%. Perishables, including produce, seafood, meat, bakery and deli, had slightly above average growth, at +6.3%. Fresh produce sales exceed the frozen food department sales this month, totaling $5.6 billion. While dollars were up, unit sales were down. It is important to note that the Easter and Passover holidays are two weeks later in 2022, with the majority of sales moving from the first quarter in 2021 to the second quarter in 2022.
March 2022 produce sales reached $5.6 billion, surpassing the record set in 2021 by 4.7%. However, dollar gains were inflation-boosted while units and volume sales declined year-on-year. “The unit and volume pressure persisted but remained within five points versus year ago,” said Watson. “In addition to inflationary pressure, it is important to recognize the effect of supply chain disruption and out-of-stocks. Assortment has been affected by the labor, transportation and other supply chain issues. Actively communicating and providing recommendations for alternatives are important best practices in case of out-of-stocks.”
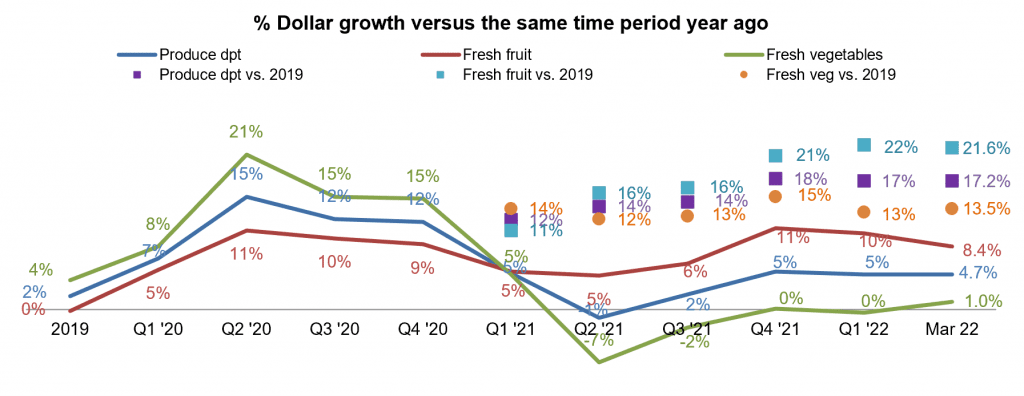
Each of the four March weeks generated around $1.4 billion, which is very similar to the weekly levels seen in the December through February weeks. Year-on-year gains were up around 5% whereas pounds were down between 4% and 6%. While fruit sales growth never dipped below year-ago levels, vegetable sales growth has trended in negative figures most of 2021 and the first quarter of 2022.
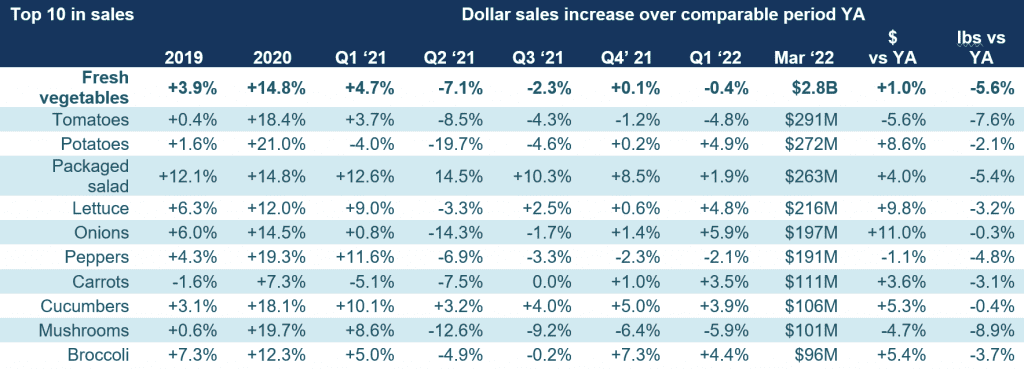
In March of 2022, in lapping those declines, vegetable dollar sales increased 1.0% year-on-year.
Fresh Produce Share of Total Fruits and Vegetables
Shelf-stable fruits and vegetables had a strong, though inflation-boosted March. Both frozen and shelf-stable are heavily impacted by supply chain disruptions and assortment and inventory levels have been down significantly over recent months. Inflation was highest for shelf-stable fruit.
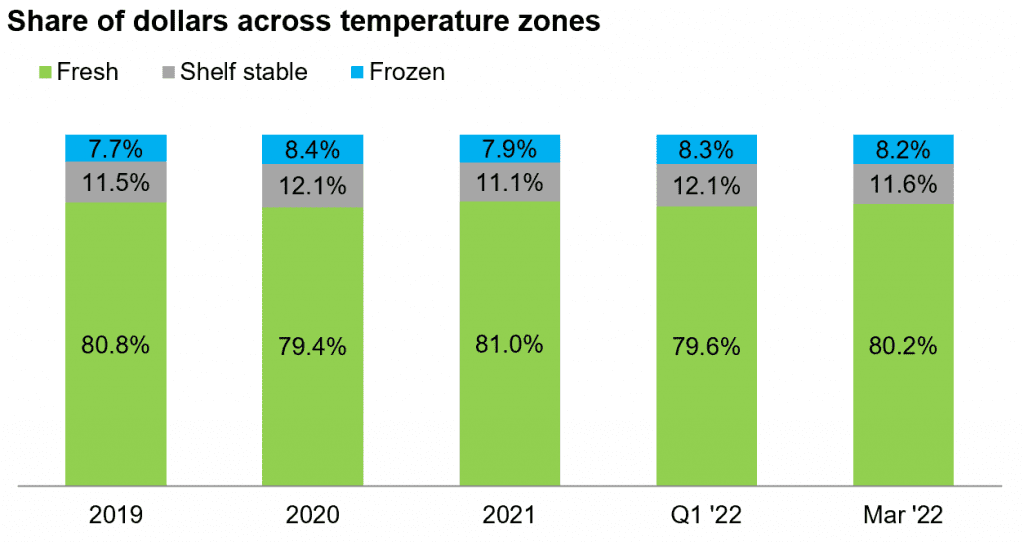
In the first quarter of 2022, just under 80% of total fruit and vegetable dollars were generated by the fresh produce department. This was close to the lows seen in 2020 despite higher inflation than the price increases seen in frozen.
As a share of total pounds sold across frozen, center store and fresh, fresh produce made up 78.3% in March and 77.2% in the first quarter. Shelf-stable fruits and vegetables represented 14.6% of pounds in the first quarter.
Fresh Produce Dollars versus Volume
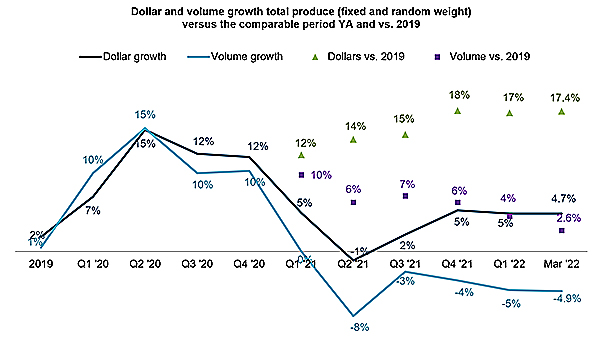
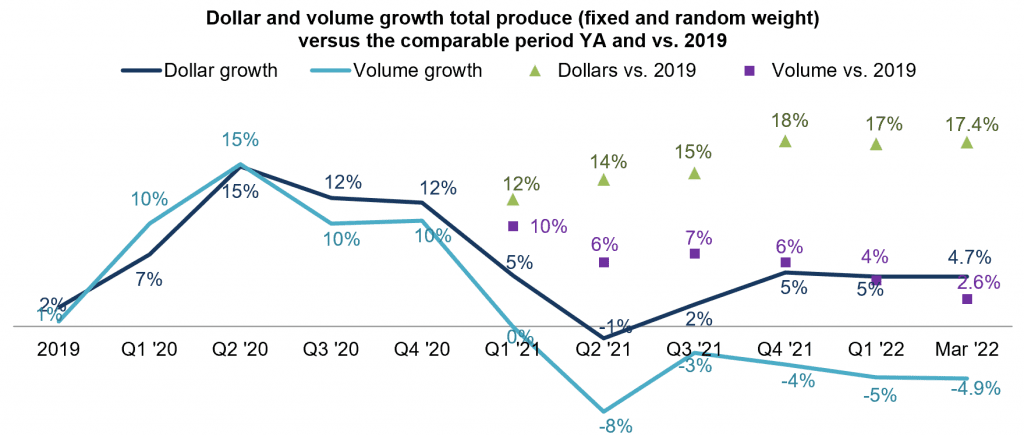
Fresh produce pound sales trailed behind year ago levels all throughout 2021 and the first quarter of 2022. In March 2022, pound sales were down 4.9% year-on-year. Importantly, compared with 2019, the pre-pandemic normal, dollars remain 17.4% ahead (green triangles) and pound sales were 2.6% higher (purple squares). However, when following the purple square trendline (pounds versus 2019), there is a continued month-to-month decrease from +10% in the first quarter of 2021 to +2.6% in March 2022.
Both fruit and vegetable pound sales remained above 2019 levels in March. The inflationary impact is highest for fruit, with a 13-point gap between dollar and volume growth versus year ago. This is down from 15-points in February 2022.
Fresh Fruit Sales in March
“For the first time since starting our reporting in March 2020, we have no month-to-month changes in the top 10 fruit sellers nor in the order in which they appear in terms of sales,” said Parker. “Berries remain the powerhouse with March sales of $714 million. The highest year-on-year gains were recorded by melons and oranges.”
Virtually all biggest sellers grew dollar sales versus year ago with the exception of bananas and mandarins. Volume sales were a different story. Only berries, melons and mixed fruit increased pound sales versus March 2021.”
Fresh Vegetables Sales in March
“Seven out of the top 10 vegetable sellers grew sales versus year ago,” said Watson. “There were a few exceptions in tomatoes, peppers and mushrooms. Pound sales versus year ago were down across the board, with onions and cucumbers coming closest to year-ago levels.”
Fresh Produce Absolute Dollar Gains
“The top 10 in absolute dollar gains shows the overwhelming strength of berries in today’s marketplace,” said Parker. “Not only are they the biggest seller across all fruits and vegetables, but they are also the biggest contributor to new dollars. In most other cases, growth is reflecting the impact of inflation. For instance, the average price per pound for limes was up 51.5% in March 2022 versus March 2021 and the price of avocados rose 35.7% on a per pound basis.”
Perishables Performance
In March, total perishables grew 6.3%, with above-average increases for bakery, deli and refrigerated, which includes dairy. Compared to March 2020, the first month of the pandemic, the only departments showing increases were deli and seafood. The highest gain versus the pre-pandemic normal of 2019 was generated by meat, up 26.0% in March of 2022 versus March 2019.
The departments still selling more units in March 2022 than they did in March 2019 are deli, meat, produce and refrigerated/dairy.


What’s Next?
- The war in Ukraine, the renewed COVID lockdowns in China, record inflation, labor shortages and supply chain challenges will have a continued effect on food and produce sales in the months to come.
- Inflation is likely to boost dollar sales while pressuring unit and volume sales.
- Easter celebrations are forecast to be bigger than in 2021 with more people celebrating and larger gatherings.
80% of consumers have purchased from restaurants in March, most commonly takeout (54%), on premise dining (48%) and delivery (23%) according to IRI’s monthly shopper survey. With the temperatures still warming up in - Northern states, a much lower 12% have eaten outdoors at restaurants.
- Online shopping is balancing out around 5% buying all groceries online, while 67% buy all groceries in store. The remaining 28% have adopted a hybrid system in which they purchase some items online and some in person. This is expected to continue as retailers continue to evolve the online experience and consumers are moving around more.
- The share of Americans stocking up on items has increased from 30% in September 2021 to 44% in March 2022. Underlying reasons range from being concerned over the item not being available on future trips (20%) to further price increases (16%).
The next report, covering April including the much later Easter, will be released in mid-May.
In addition to the data provided here, the IFPA also now offers InSite – an online interactive data set covering both produce and floral performance as well as a look at the 2021 consumer sentiment surveys. Start your free trial today! See www.freshproduce.com/insite for more detail.
We also encourage you to contact Joe Watson, IFPA’s VP, Retail, Foodservice and Wholesale, at jwatson@freshproduce.com with any questions or concerns. Please recognize the continued dedication of the entire grocery and produce supply chains, from farm to retailer.
Date ranges:
2019: 52 weeks ending 12/28/2019
2020: 52 weeks ending 12/27/2020
Q1 2021: 13 weeks ending 3/28/2021
Q2 2021: 13 weeks ending 6/27/2021
Q3 2021: 13 weeks ending 9/26/2021
Q4 2021: 13 weeks ending 12/26/2021
Q1 2022: 13 weeks ending 3/27/2022
January 2022: 5 weeks ending 1/30/2022
February 2022: 4 weeks ending 2/27/2022
March 2022: 4 weeks ending 3/27/2022


